Visualising the Conflict
Geographic Information Systems (GIS) Maps
Maps -
List of Map Sets |
This page contains a list, with details of the various formats, of the Geographic Information Systems (GIS) maps that have been produced as part of the AHRC 'Visualising the Conflict' Project.
All maps were compiled and prepared by Luke Kelleher, then a Research Associate (GIS) working with CAIN. There are 24 categories of maps, listed below, with links to separate Web pages where the individual maps are listed (202 maps in total). All maps were sized A4 (approximately). GIS software was used to produce TIFF versions (A4 approx; 300dpi) which are available on request. Three versions of each map have been made available below:
- PDF versions (A4 approx; 300dpi) are based on original TIFF files.
- L-JPG versions (approx. 1000px700p; 72dpi) are low resolution JPEG images.
- H-JPG versions (approx. A4; 300dpi) are high resolution JPEG images.
The maps relate to deaths due to the conflict and also physical memorials to the conflict. The information on deaths is taken (with permission) from Malcolm Sutton's Index of Deaths. The information on commemoration comes from the database of physical memorials.
In addition to the 'static' maps a number of animations have also been prepared. These animations are made up of a number of maps, which are shown sequentially with a short time delay, and are designed to highlight, for example, changes over time. The animations are based on GIFF (.gif) images and have been set to play once. They can be replayed on most Web browsers by either reloading the image or clicking on the link a second time.
Kelleher, Luke., and Melaugh, Martin. (2011). Visualising the Conflict: Immersion in the Landscape of Victims and Commemoration in Northern Ireland, (21 May 2011), Paper Presented at Conference: Urban Conflicts - Ethno-National Divisions, States and Cities, 1921 May 2011, Queens University Belfast. [PDF; 862KB]
The maps have been produced and made available with the permission of Land & Property Services under Delegated Authority from the Controller of HMSO, © Crown Copyright and database right 2010; Permit Number: 40209.
Users are free to download the maps (and other information) for 'private study'; this includes use in student essays, dissertations, etc. The maps can also be downloaded for other educational use, for example as part of a one-off PowerPoint presentations. The maps should NOT be reproduced on any Web site. Commercial use, for example in academic journal articles, or books, or magazines, will require the permission of CAIN and Land & Property Services.
Please acknowledge the source of any map used. The following format is provided as a guide:
CAIN Web Service. (2010). Spatial intensity of death locations in Belfast (1969-2001), and Northern Ireland Multiple Deprivation Measure score 92005), at ward level [Map]. "Visualising the Conflict GIS Maps", http://cain.ulster.ac.uk/victims/gis/maps/l-jpg/CAIN-Map_Belfast_Deprivation_Contour.jpg (accessed 20 January 2012).
The 202 maps are categorised into the following 24 sets. The links below are to separate pages where the individual maps are presented. (Click on either the map set title or the thumbnail map to view the full list of maps in each set.) As described in the introduction above, users can download the maps in three formats.
| Outline and Background Maps |
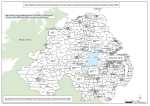 Map Set 1: Map Set 1: 
Outline Maps, by area, of Ward Boundaries (1995)
8 maps
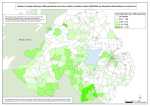
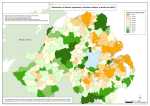 Map Set 2: Map Set 2:
Distribution of Catholic population at ward level in Northern Ireland, Belfast and Derry, with peacelines
3 maps
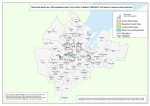
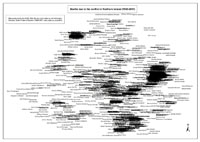 Map Set 3: Map Set 3:
Text Maps - Deaths indicated by names, by area (Northern Ireland, Belfast, Derry)
3 maps
See also:
Animation of above Northern Ireland map
1 animation
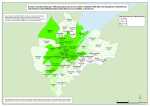
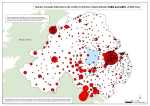
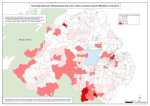 Map Set 4: Map Set 4:
Deaths (1969-2001), by area (Northern Ireland, Belfast, Derry), and by status, at ward level
15 maps
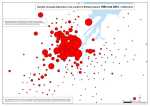
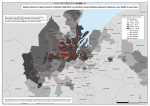
 Map Set 5: Map Set 5:
Killings (1969-2001), by area (Northern Ireland, Belfast, Derry), and by organisation, at ward level
9 maps
| Deaths / Kilings with Deprivation Score |
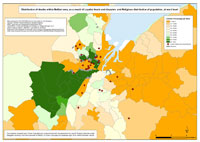
 Map Set 6: Map Set 6:
Deaths (1969-2001), by area (Belfast, Derry), and by status, with Multiple Deprivation Measure score, at ward level
10 maps
 Map Set 7: Map Set 7:
Killings (1969-2001), by area (Belfast, Derry), and by organisation, with Multiple Deprivation Measure score, at ward level
6 maps
 Map Set 8: Map Set 8:
Female Death Rates (per 1000 population) due to the conflict (1969-2001), by area (Northern Ireland, Belfast, Derry), at ward level
3 maps
 Map Set 9: Map Set 9:
Female Death Rates (per 1000 population) due to the conflict (1969-2001), by area (Belfast, Derry), and Multiple Deprivation Measure score, at ward level
2 maps
 Map Set 10: Map Set 10:
Child victims of the conflict, Belfast, Derry and Northern Ireland
3 maps
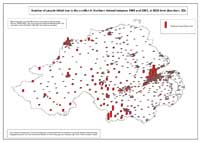
 Map Set 11: Map Set 11:
Number of people killed due to the conflict in Northern Ireland, by year (1969-2001), at SOA (Small Output Area)
34 maps
See also:
Animation of above maps
1 animation
 Map Set 12: Map Set 12:
Number of people killed due to the conflict in Belfast, by year (1969-2001), at SOA (Small Output Area)
34 maps
See also:
Animation of above maps
1 animation
 Map Set 13: Map Set 13:
Deaths, by area (Northern Ireland, Belfast, Derry), by 5 year groups, at 1km grid square level
24 maps
See also:
Animations of above maps
3 animations
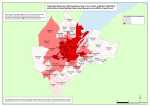
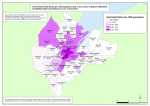
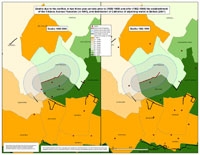
 Map Set 14: Map Set 14:
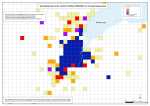
Spatial Intensity Maps - Death locations (1969-2001), by area (Belfast, Derry) and Northern Ireland Multiple Deprivation Measure score (2005), at ward level
2 maps
| Bar, Pie, Stacked Bar, and 3D Maps |
 Map Set 15: Map Set 15:
Bar Chart Maps - Deaths (1969-2001), by area (Belfast, Derry), by status, at ward level
2 maps
 Map Set 16: Map Set 16:
Pie Chart Maps - Deaths (1969-2001), by area (Belfast, Derry), by status, at ward level
2 maps
 Map Set 17: Map Set 17:
Stacked Bar Chart Maps - Deaths (1969-2001), by area (Belfast, Derry), by status, at ward level
2 maps
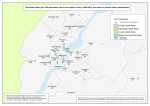
 Map Set 18: Map Set 18:
Maps - Number of people killed due to the conflict in Northern Ireland, Belfast and Derry, between 1969 and 2001, at SOA (Small Output Area) (barchart, 3D)
3 maps
| Feuds and Alleged Informers |
 Map Set 19: Map Set 19:
Maps - Locations of deaths as a result of paramilitary feuds, Belfast
2 maps
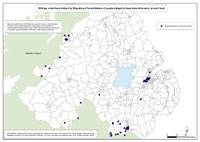 Map Set 20: Map Set 20:
Maps - Locations of killings of alleged informers, Belfast and Northern Ireland
3 maps
 Map Set 21: Map Set 21:
Maps - Deaths due to the conflict, close to selected peacelines in Belfast, and distribution of Catholics of adjoining wards
7 maps
| Deaths outside Northern Ireland |
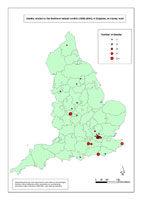 Map Set 22: Map Set 22:
Maps - Location of deaths related to the Northern Ireland conflict, in England, Europe, and the Republic of Ireland
4 maps
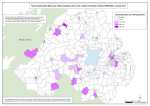
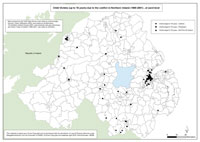
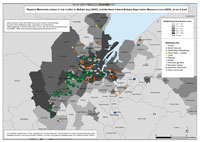 Map Set 23: Map Set 23:
Maps - Physical memorials related to the conflict, in Belfast, Derry, and Northern Ireland
7 maps
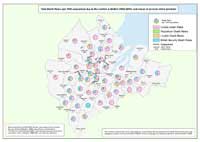
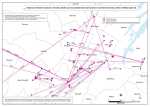 Map Set 24: Map Set 24:
Maps - Distances between locations of deaths and associated memorials (closest recorded memorial), Belfast, Derry, and Northern Ireland
8 maps
|