
|
|
|
|
|
|
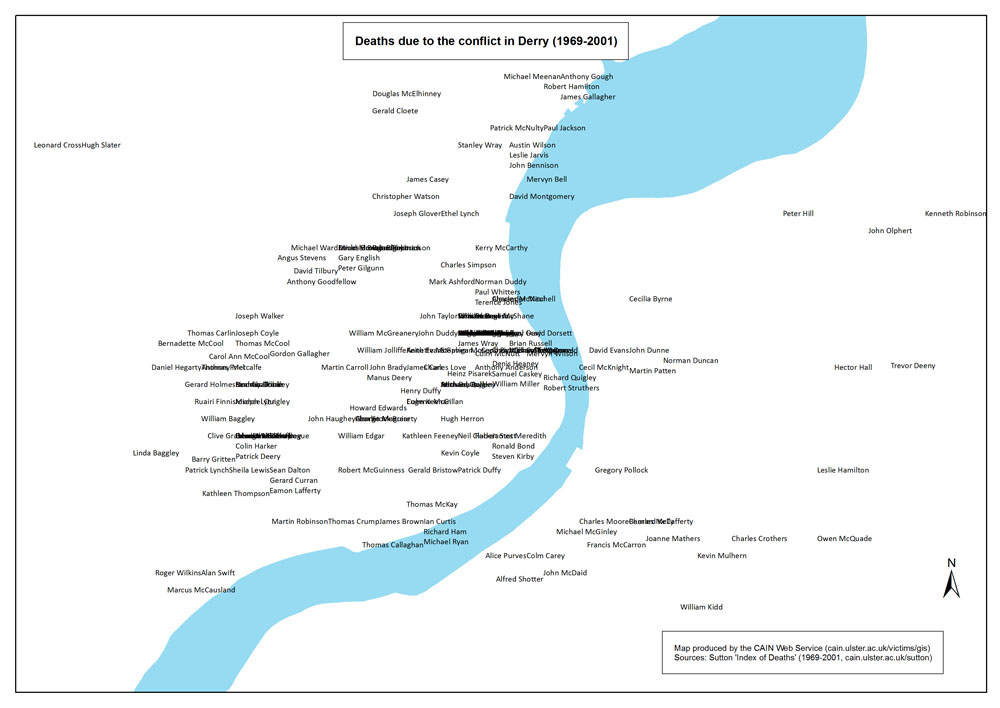
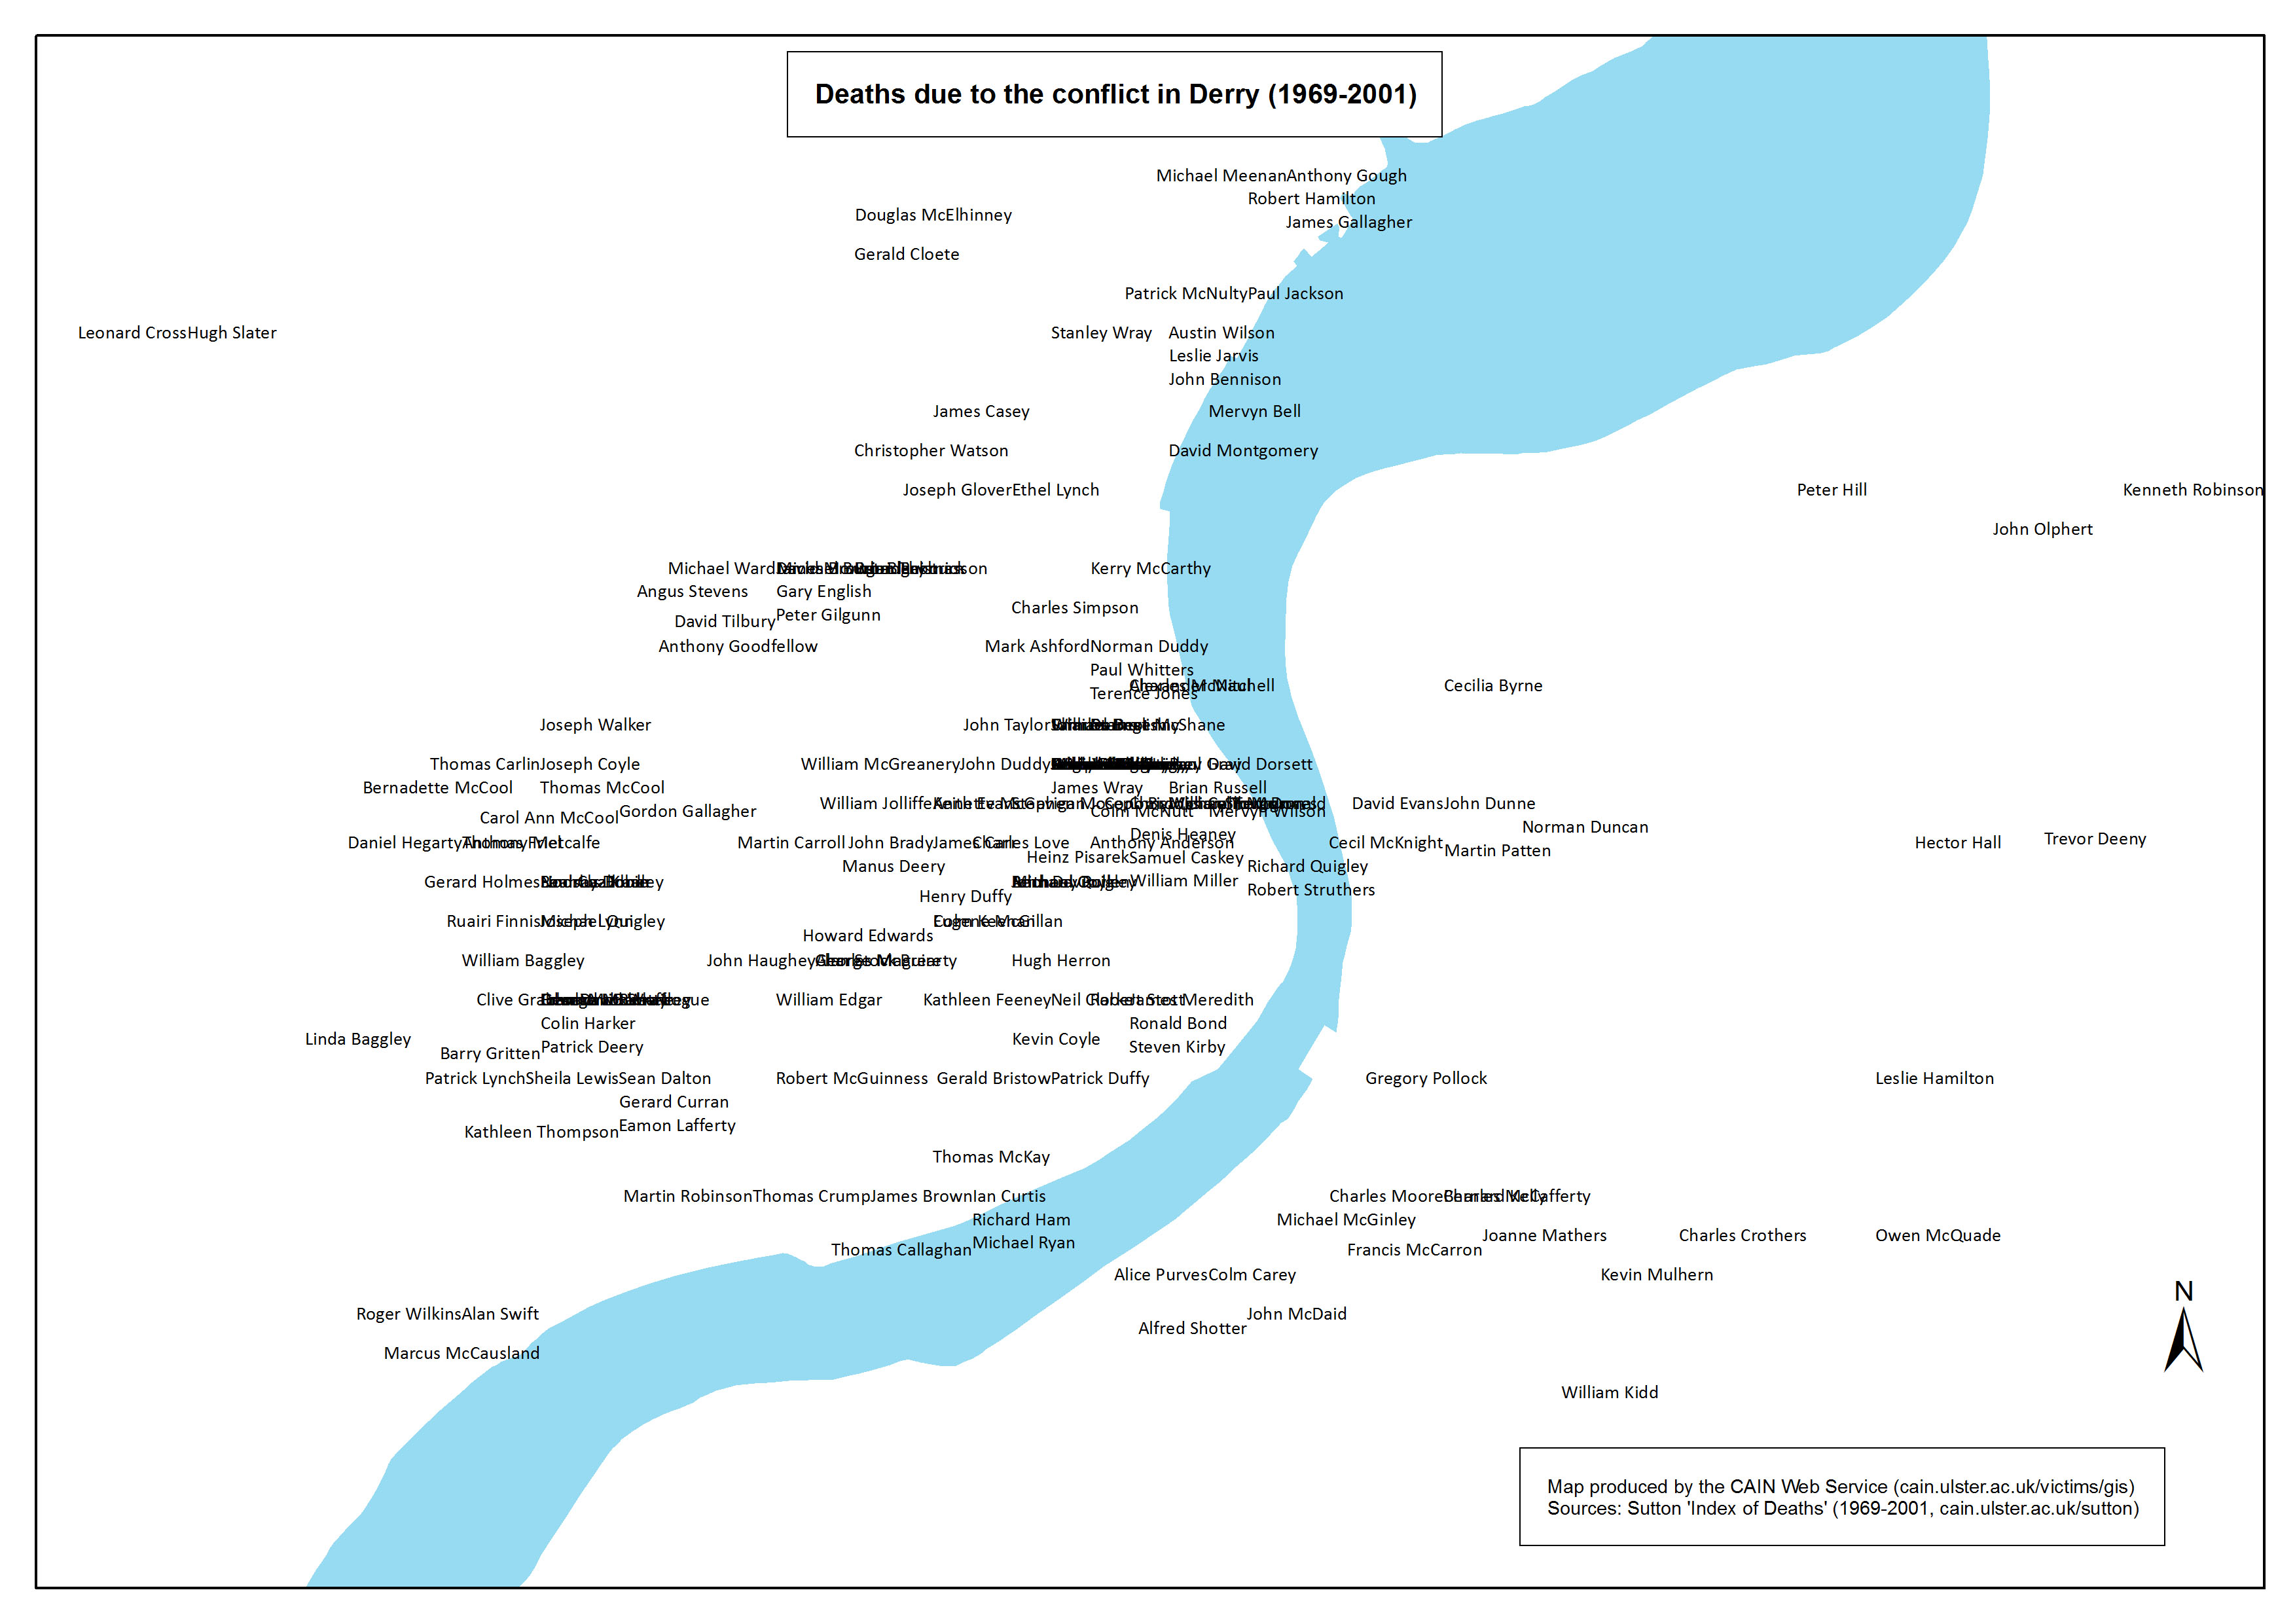
Text Maps - Deaths indicated by names, by area (Northern Ireland, Belfast, Derry) (3 maps)
An animation (animated GIF image) has been produced for the Northern Ireland text map. The animation begins with an image of a randomly selected point displaying the names of people killed at that location. As each subsequent image is added the zoom level is increased to reveal more names. The end result is a 'map' of Northern Ireland that is implied by the names displayed on the final image.
One of the first maps produced as part of the Visualising the Conflict project was a simple 'text map' made up of the names of those who were killed in Northern Ireland during the conflict. When the names were plotted using GIS mapping it was apparent that the outline of Northern Ireland could be discerned despite no geographical mapping (coastlines, borders, etc.) being present. By overwriting the names a very rough guide to the intensity of the conflict could also be distinguished. For those with knowledge of the distribution of deaths due to the conflict (1969-2001), the map for Northern Ireland should be familiar. It shows the intensity of the conflict in Belfast, Derry, south Armagh, and north Armagh. Likewise the Belfast map shows the intensity of deaths in north and west Belfast. The animation is based on a set of images which begin at a very detailed level (thus only displaying a few names) and then subsequently zoom out to show more and more of the area of Northern Ireland. The final image is equivalent to the Northern Ireland 'text map'. While the names are plotted using GIS co-oridinates the maps are not meant to be viewed as as conventional maps but rather to give an impression of the spread and intensity of the conflict within Northern Ireland.
The names which are displayed in the above maps were extracted, with permission, from Malcolm Sutton's Index of Deaths.
The GIS maps listed above have been produced as part of the AHRC 'Visualising the Conflict' Project. The maps have been reproduced and made available with the permission of Land & Property Services under Delegated Authority from the Controller of HMSO, © Crown Copyright and database right 2010; Permit Number: 40209. All maps were prepared by Luke Kelleher, then a Research Associate (GIS) working with CAIN. All maps were sized A4 (approximately). GIS software was used to produce TIFF versions (A4 approx; 300dpi) which are available on request. Three versions of each map have been made available above:
The animation is made up of a number of maps, which are shown sequentially with a short time delay. The animation is based on GIFF (.gif) images and has been set to play once. It can be replayed on most Web browsers by either reloading the image or clicking on the link a second time.
Return to List of Map Sets
|
|||||||||||||||||||||||||||||||||||||
|
Last modified:
January 18, 2012 22:47
|
||
|
|
||
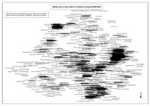 Listed below is a series of 3 maps which are based on pieces of text, in this case the names of people killed during the conflict in Northern Ireland, which have been positioned using GIS mapping. While the text is positioned accurately no background mapping information is included on the Northern Ireland map, and only the rivers on the Belfast and Derry maps. Where more than one death has occurred at a particular site the names are overlaid, thus the intensity of deaths is simply indicated by the amount of black ink on the map.
 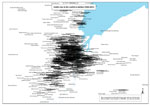 Text Map - Names - Belfast area
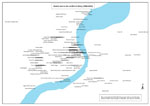 Text Map - Names - Derry area
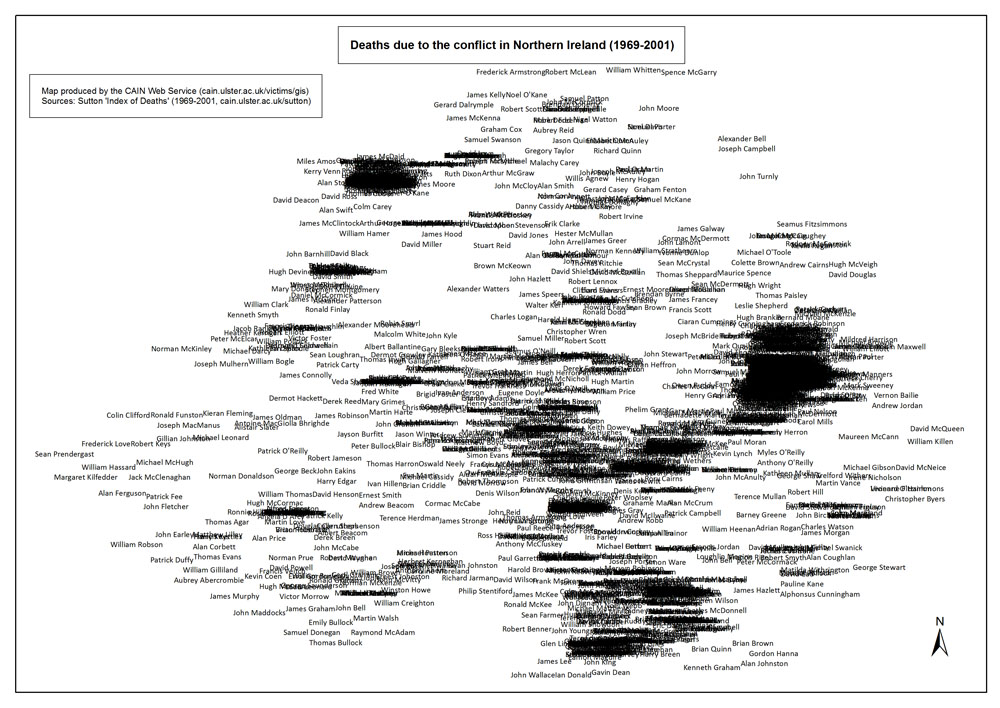