Visualising the Conflict
Geographic Information Systems (GIS) Maps
Map Set 17:
Deaths Stacked Bar Chart Maps
Maps drawn by Luke Kelleher; text by Martin Melaugh |
| Map Set 17: Deaths Stacked Bar Chart Maps - Introduction |
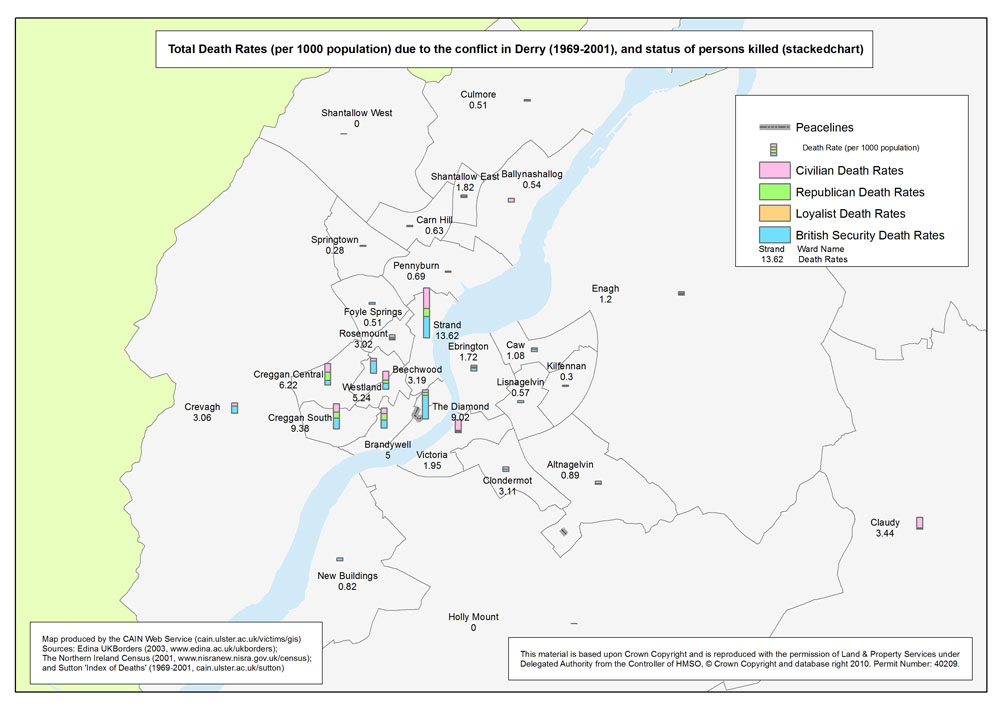
Stacked Bar Chart Maps - Total death rates (1969-2001), by area (Belfast, Derry), by status, at ward level (2 maps)
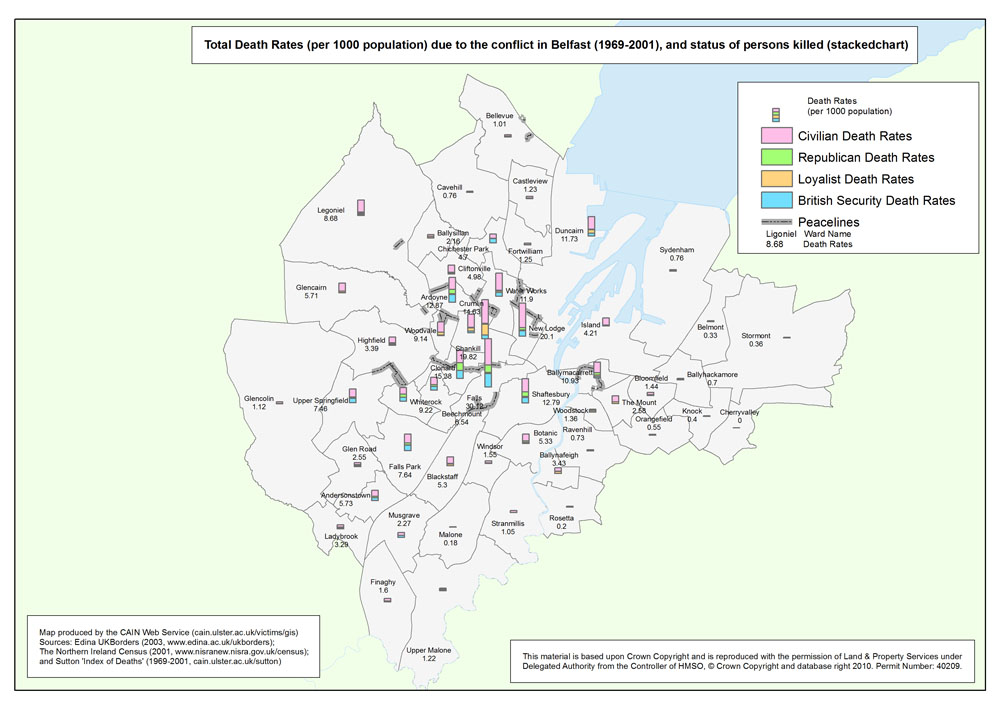
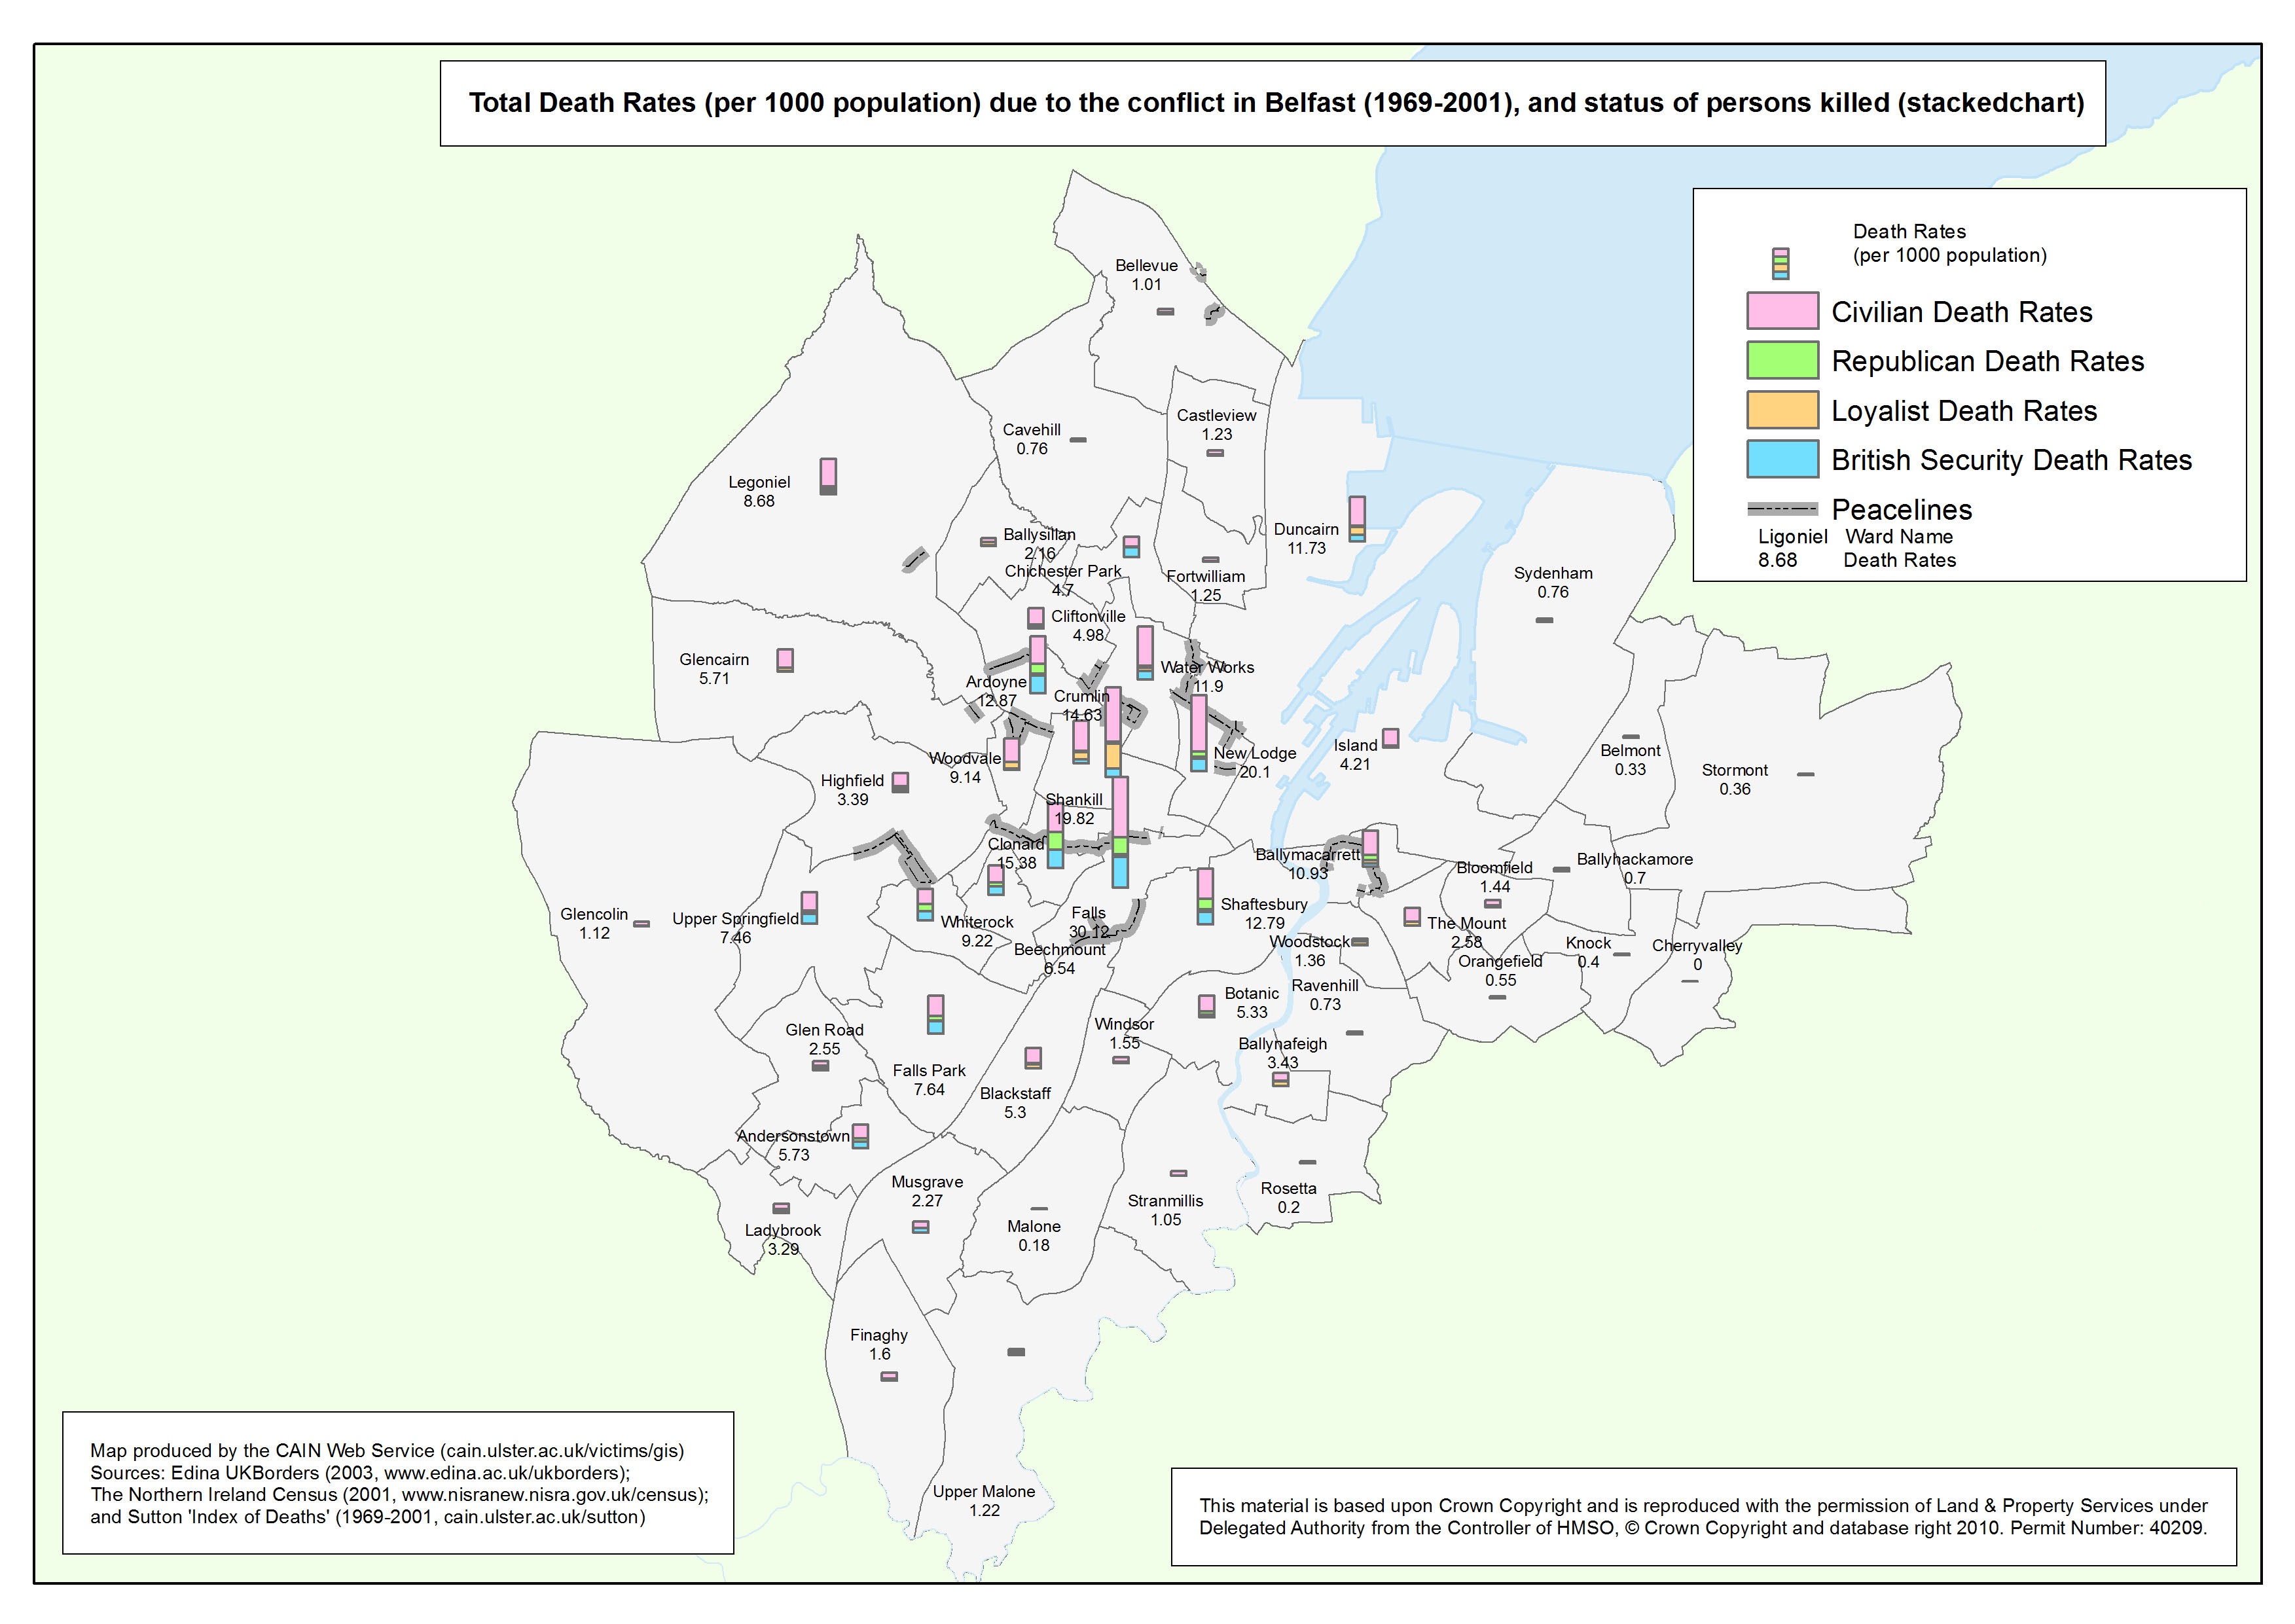
 This set of maps focuses on the urban areas of Belfast and Derry. The maps show the total death rates per 1000 population at ward level, due to the conflict, and employ a stacked bar chart to identify the status of the victims within each ward. The information used to locate and plot each death is provided by Malcolm Sutton’s Index of Deaths 1969-2001. This set of maps focuses on the urban areas of Belfast and Derry. The maps show the total death rates per 1000 population at ward level, due to the conflict, and employ a stacked bar chart to identify the status of the victims within each ward. The information used to locate and plot each death is provided by Malcolm Sutton’s Index of Deaths 1969-2001.
There are 582 electoral wards in Northern Ireland as defined by the Boundary Commission for Northern Ireland in 1995. The electoral ward shapefile was downloaded from EDINA borders website.
The ‘peacelines’ erected during the troubles with the intention of minimising conflict at interface areas are identified and located. The peacelines shapefile was downloaded from the Northern Ireland Statistics and Research Agency (NISRA).
| Stacked Bar Chart Maps - Total death rates (1969-2001), by area (Belfast, Derry), by status, at ward level (2 maps compiled and drawn by Luke Kelleher) |
| Title of Map |
File Version |
| PDF
| L-JPG
| H-JPG
|
Stacked Bar Chart Map - Belfast
Total Death Rates (per 1000 population) due to the conflict in Belfast (1969-2001), by status, at ward level (Pie Chart). |
.pdf
469kb |
.jpg
124kb |
.jpg
800kb |
 Stacked Bar Chart Map - Derry Stacked Bar Chart Map - Derry
Total Death Rates (per 1000 population) due to the conflict in Belfast (1969-2001), by status, at ward level (Pie Chart). |
.pdf
426kb |
.jpg
113kb |
.jpg
707kb |
| Deaths Stacked Bar Charts: Sources |
The number of deaths is based on the Malcolm Sutton Index of Deaths (1969-2001):
http://www.cain.ulster.ac.uk/sutton/
The electoral ward shapefile was downloaded from EDINA borders website:
http://borders.edina.ac.uk/html/lut_download/ni_ward.html
The peacelines shapefile was downloaded from the Northern Ireland Statistics and Research Agency:
http://www.nisra.gov.uk/geography/default.asp12.htm
The GIS maps listed above have been produced as part of the AHRC 'Visualising the Conflict' Project. The maps have been reproduced and made available with the permission of Land & Property Services under Delegated Authority from the Controller of HMSO, © Crown Copyright and database right 2010; Permit Number: 40209.
All maps were prepared by Luke Kelleher, then a Research Associate (GIS) working with CAIN. All maps were sized A4 (approximately). GIS software was used to produce TIFF versions (A4 approx; 300dpi) which are available on request. Three versions of each map have been made available above:
- PDF versions (A4 approx; 300dpi) are based on original TIFF files.
- L-JPG versions (1000px700p approx; 72dpi) are low resolution JPEG images.
- H-JPG versions (A4 approx; 300dpi) are high resolution JPEG images.
Return to List of Map Sets
|
