
|
|
|
|
|
|
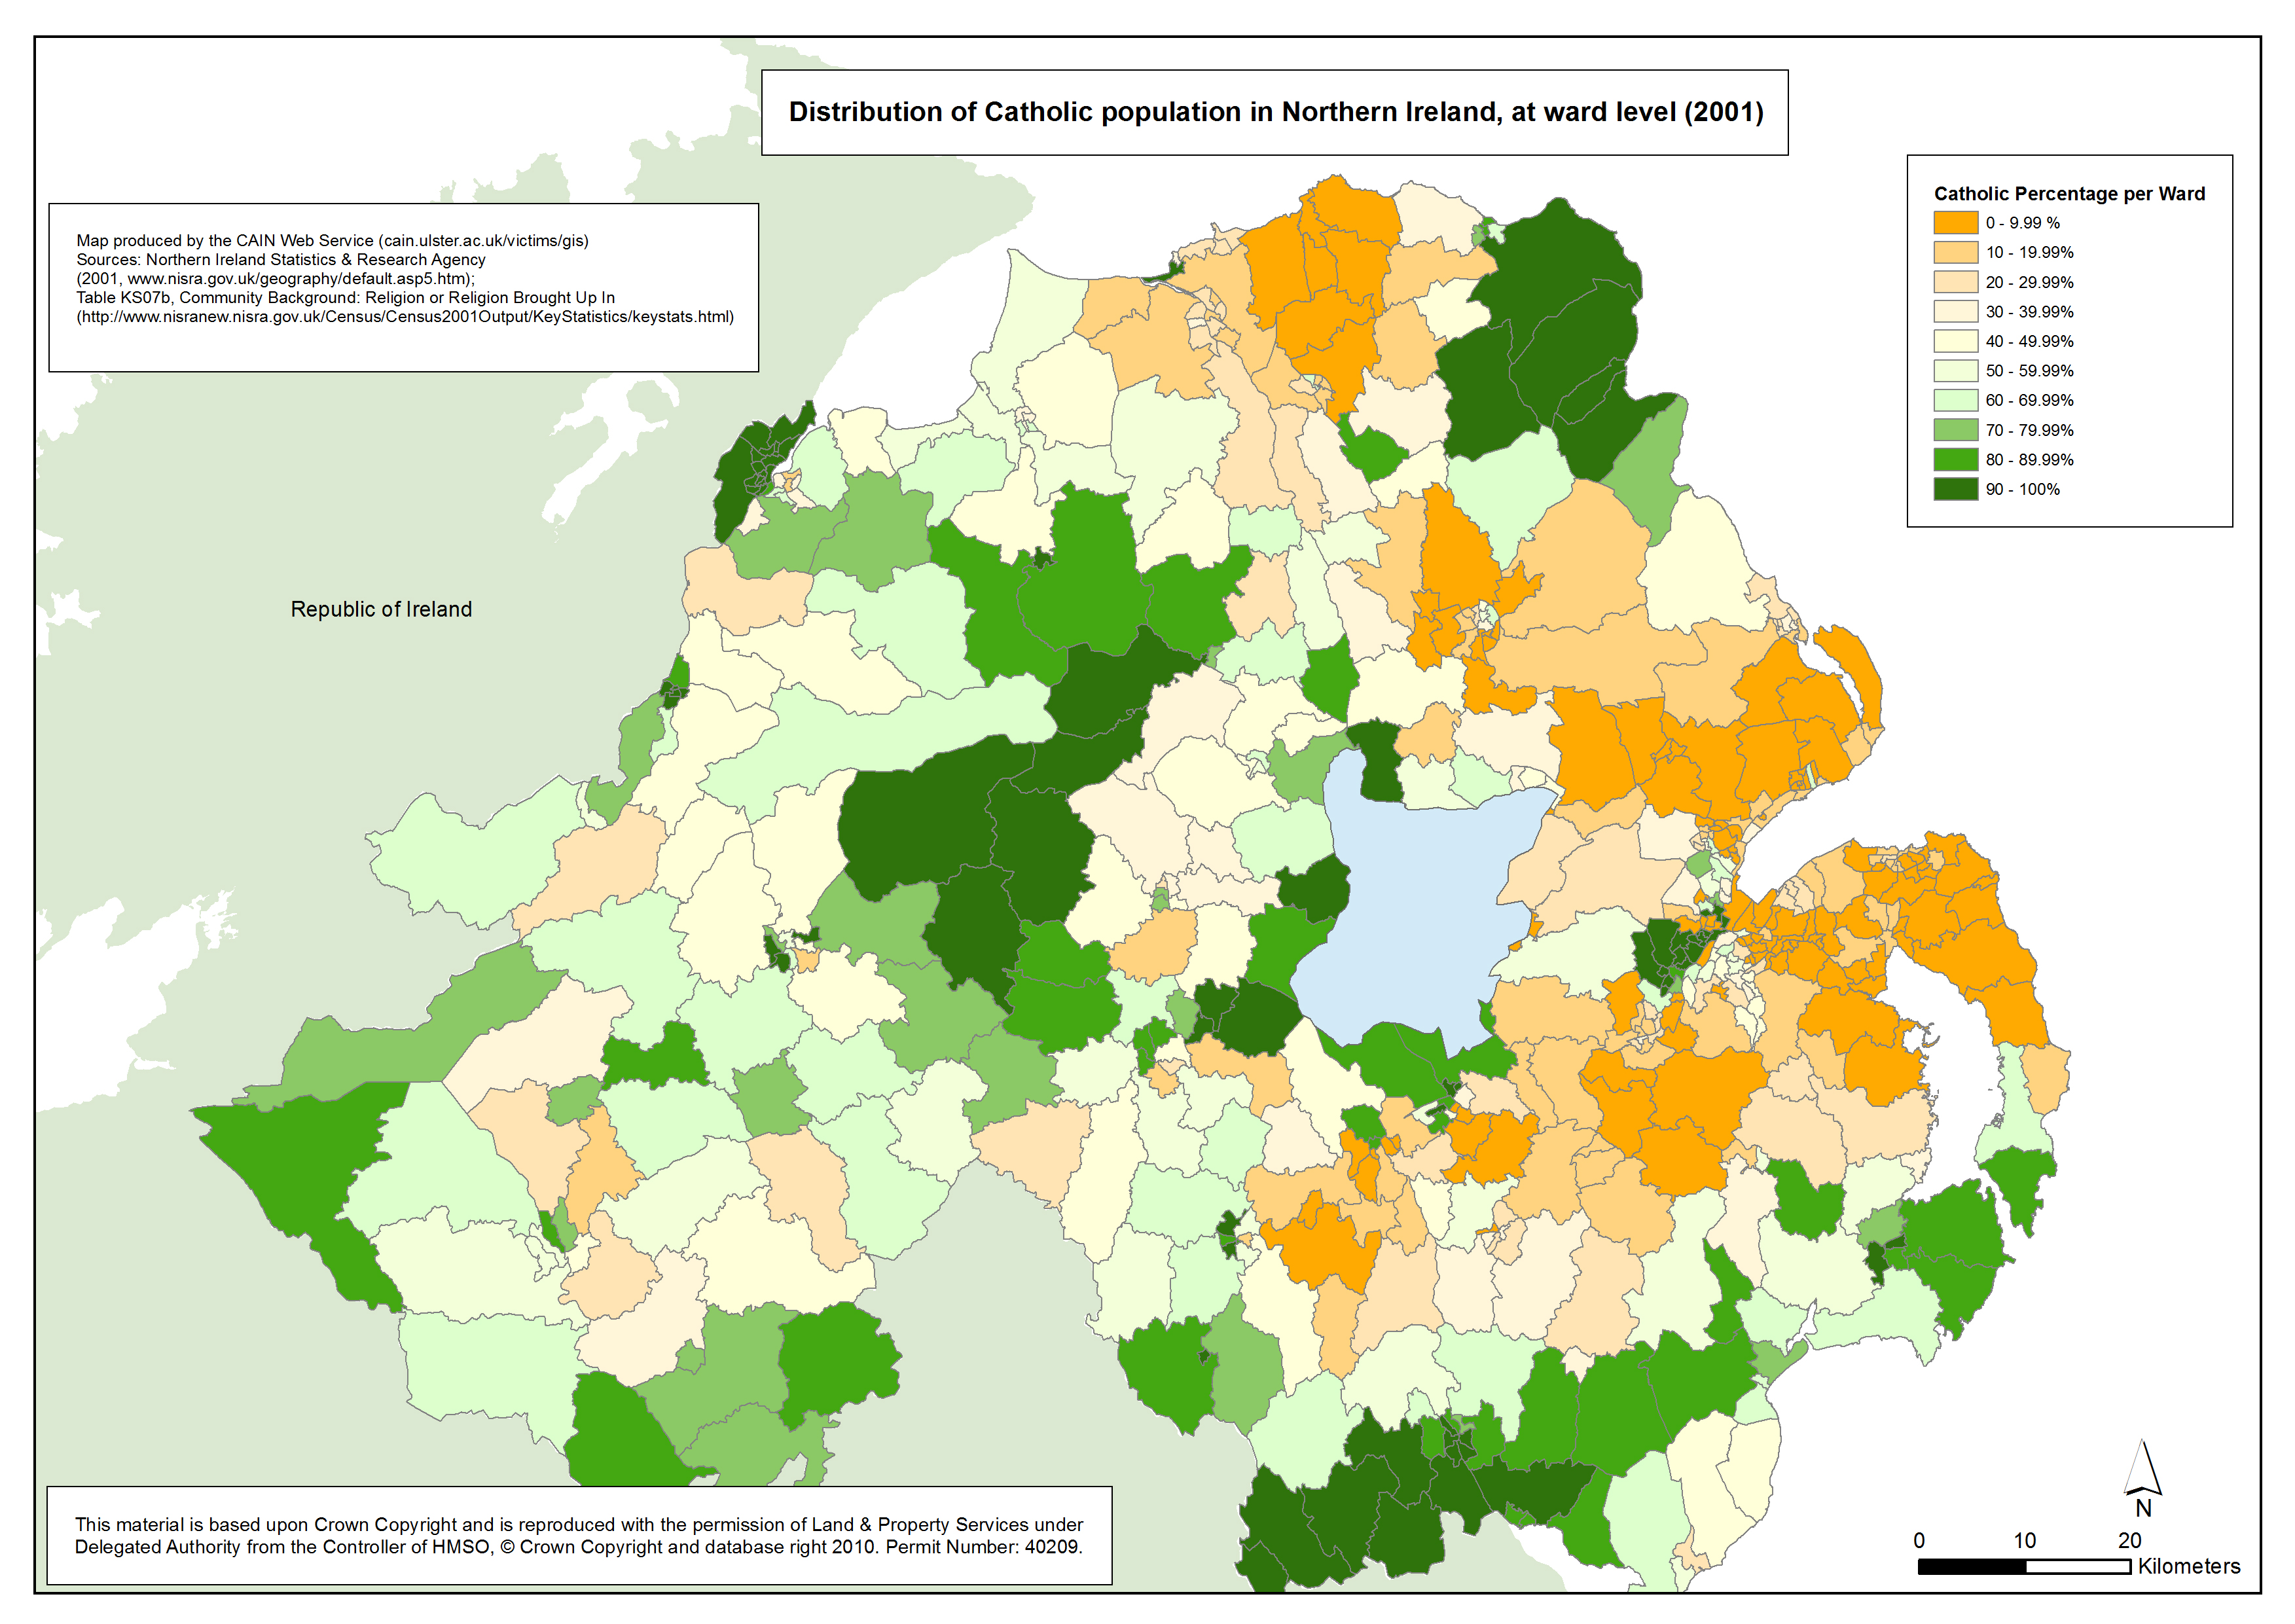
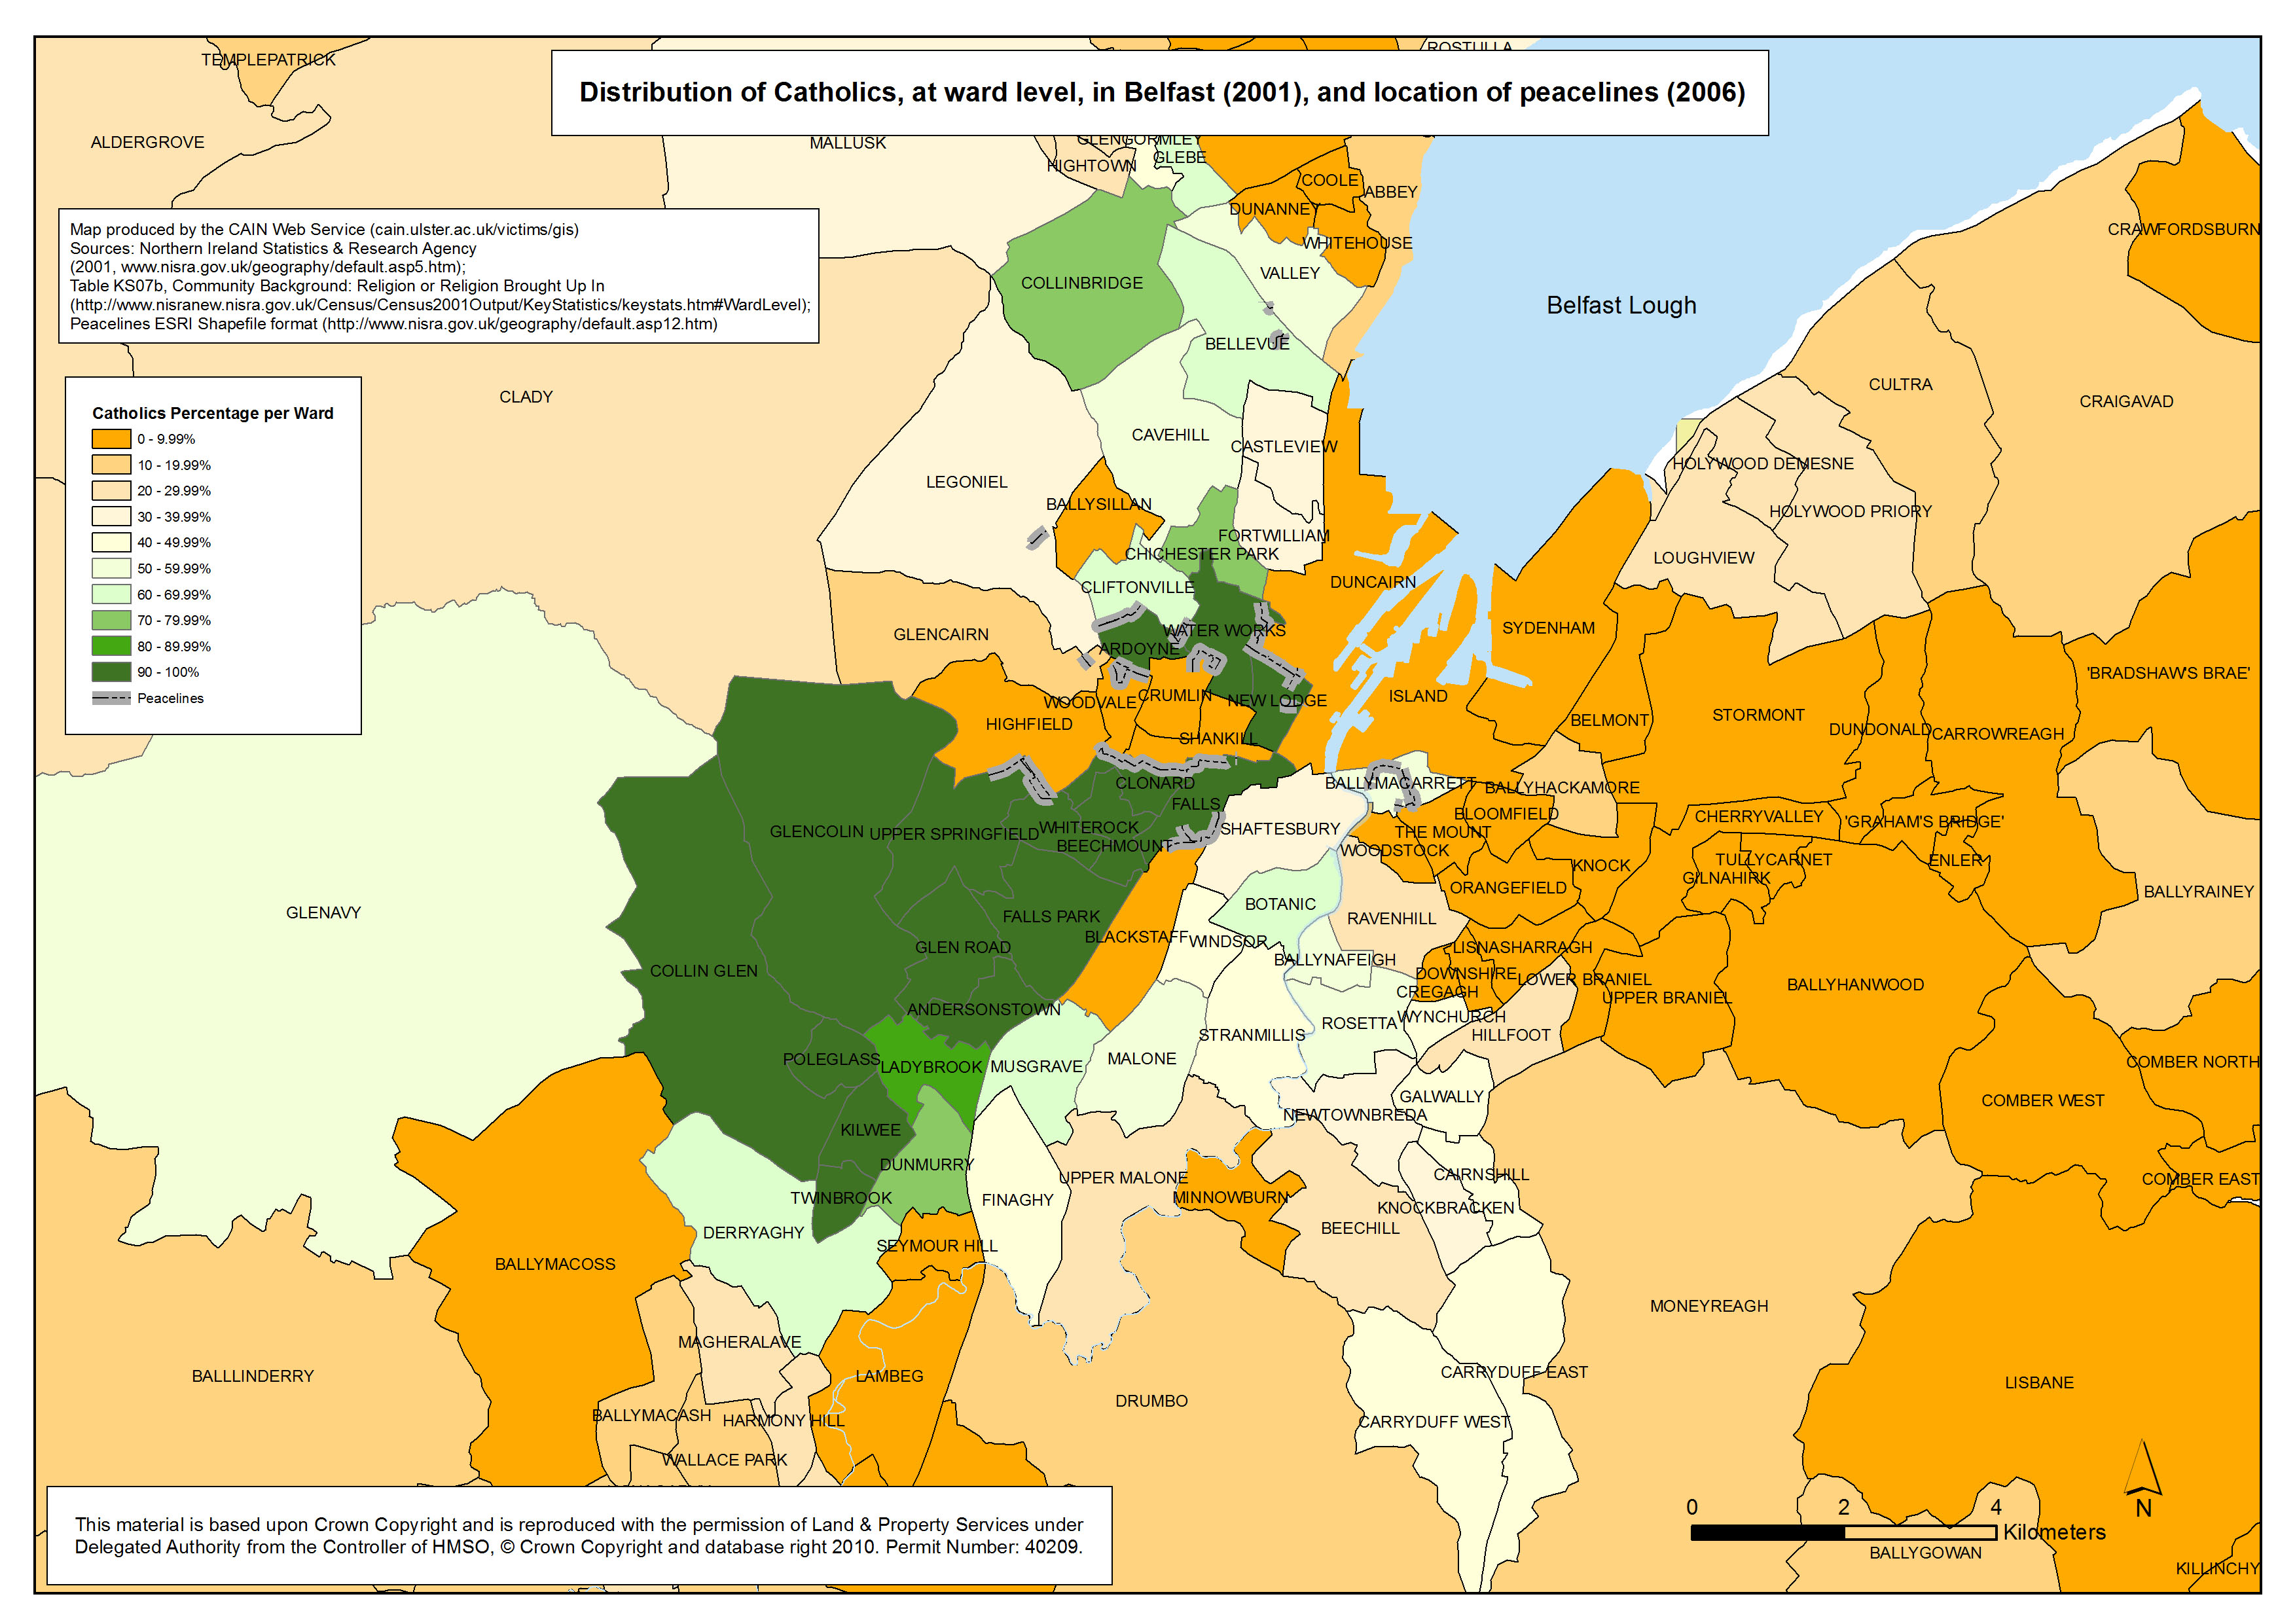
Maps showing the religious distribution of the Northern Ireland population (based on the 2001 Census) have been produced by other researchers (including some which featured on CAIN; see Maps for Greater Belfast and Northern Ireland). However, it was felt important to reproduce these maps for people using the other map sets featured in this section. The patchwork distribution of Catholics and Protestants across the region can be traced back to the plans enacted during the Plantation of Ulster (from 1609). While there have been many changes over the past 400 years it is surprising how persistent the basic patterns of settlement have been. Some may notice a correlation between areas with a large proportion of Catholics, and areas of marginal agricultural land including uplands. This outcome is explained because the new Protestant settlers wanted the best, most fertile land which tended to lie in the lowlands. For those not familiar with Northern Ireland it is worth pointing out that some wards can appear mixed in these maps but they are in fact highly segregated within the ward. So, for example, there are wards in Belfast which have a peaceline running through them with Catholics and Protestant living on either side of the dividing wall.
The electoral ward shapefile was downloaded from EDINA borders Web site. The religious background data was downloaded from the Northern Ireland Statistics and Research Agency (NISRA) Web site:
The ‘peacelines’ erected during the troubles with the intention of minimising conflict at interface areas are identified and located. The peacelines shapefile was downloaded from the Northern Ireland Statistics and Research Agency (NISRA) Web site:
The GIS maps listed above have been produced as part of the AHRC 'Visualising the Conflict' Project. The maps have been reproduced and made available with the permission of Land & Property Services under Delegated Authority from the Controller of HMSO, © Crown Copyright and database right 2010; Permit Number: 40209. All maps were prepared by Luke Kelleher, then a Research Associate (GIS) working with CAIN. All maps were sized A4 (approximately). GIS software was used to produce TIFF versions (A4 approx; 300dpi) which are available on request. Three versions of each map have been made available above:
Return to List of Map Sets
|
|||||||||||||||||||||||||
|
Last modified:
January 18, 2012 22:44
|
||
|
|
||
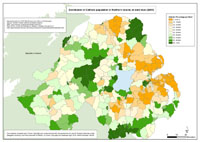 This set of three maps, illustrates the distribution of the Catholic population (and thus also the Protestant population) in Belfast, Derry and Northern Ireland as a whole. Data is mapped at electoral ward level and is based on the 2001 Northern Ireland Census survey results. There are 582 electoral wards in Northern Ireland as defined by the Boundary Commission for Northern Ireland in 1995.
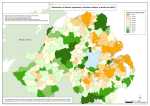 Catholics - Northern Ireland - Ward
 Catholics - Belfast - Ward
 Catholics - Derry - Ward
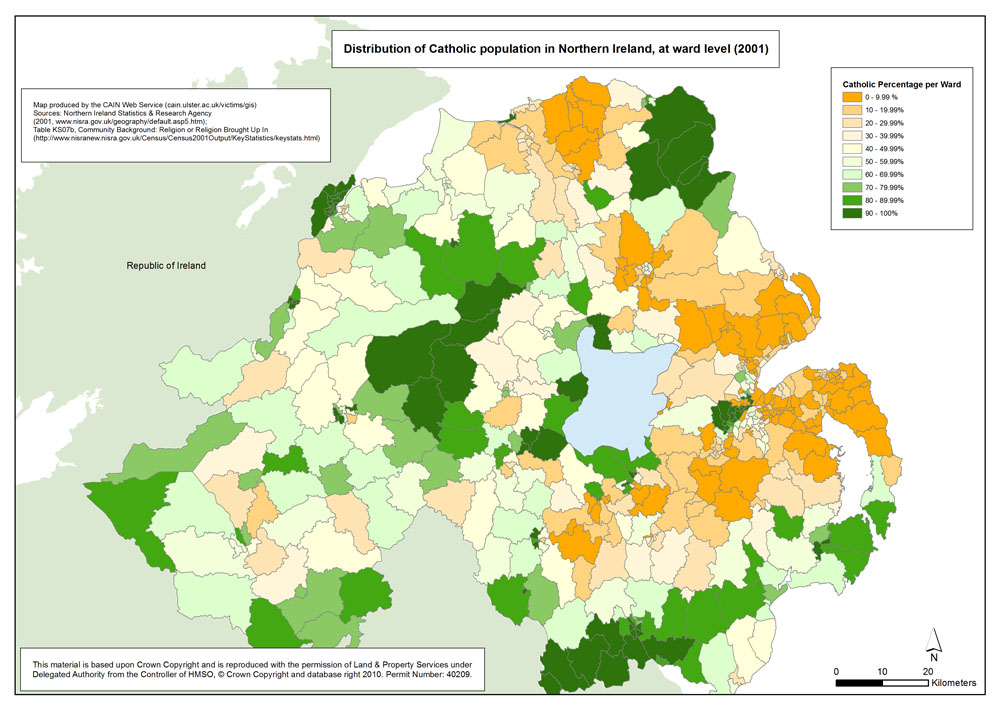