Visualising the Conflict
Geographic Information Systems (GIS) Maps
Map Set 14:
Spatial Intensity Maps |
| Map Set 14: Spatial Intensity Maps - Introduction |
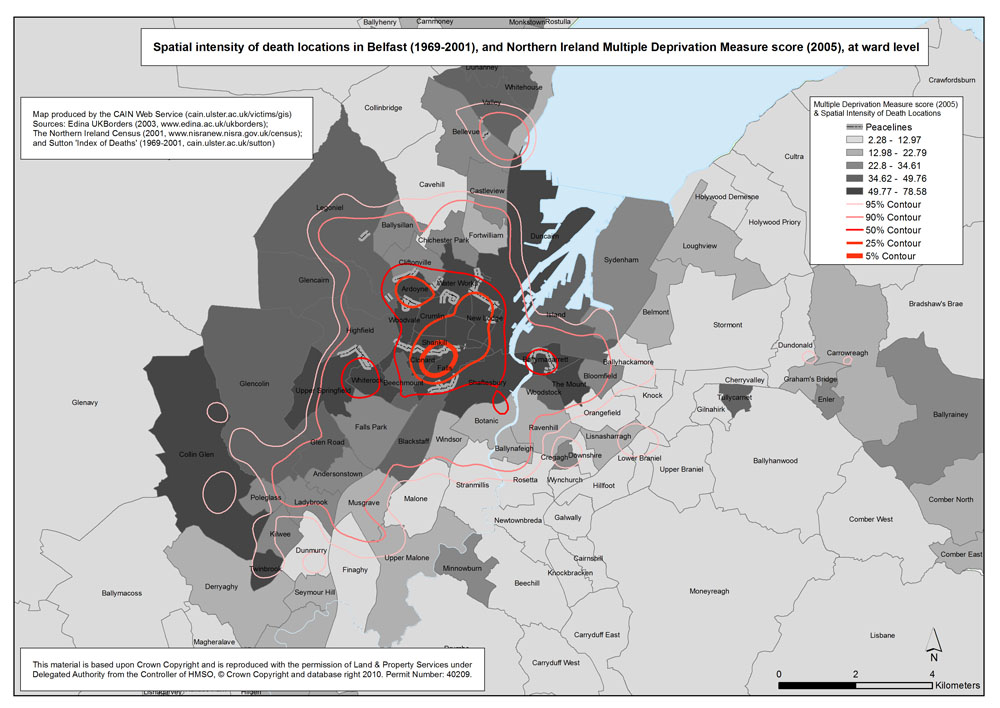
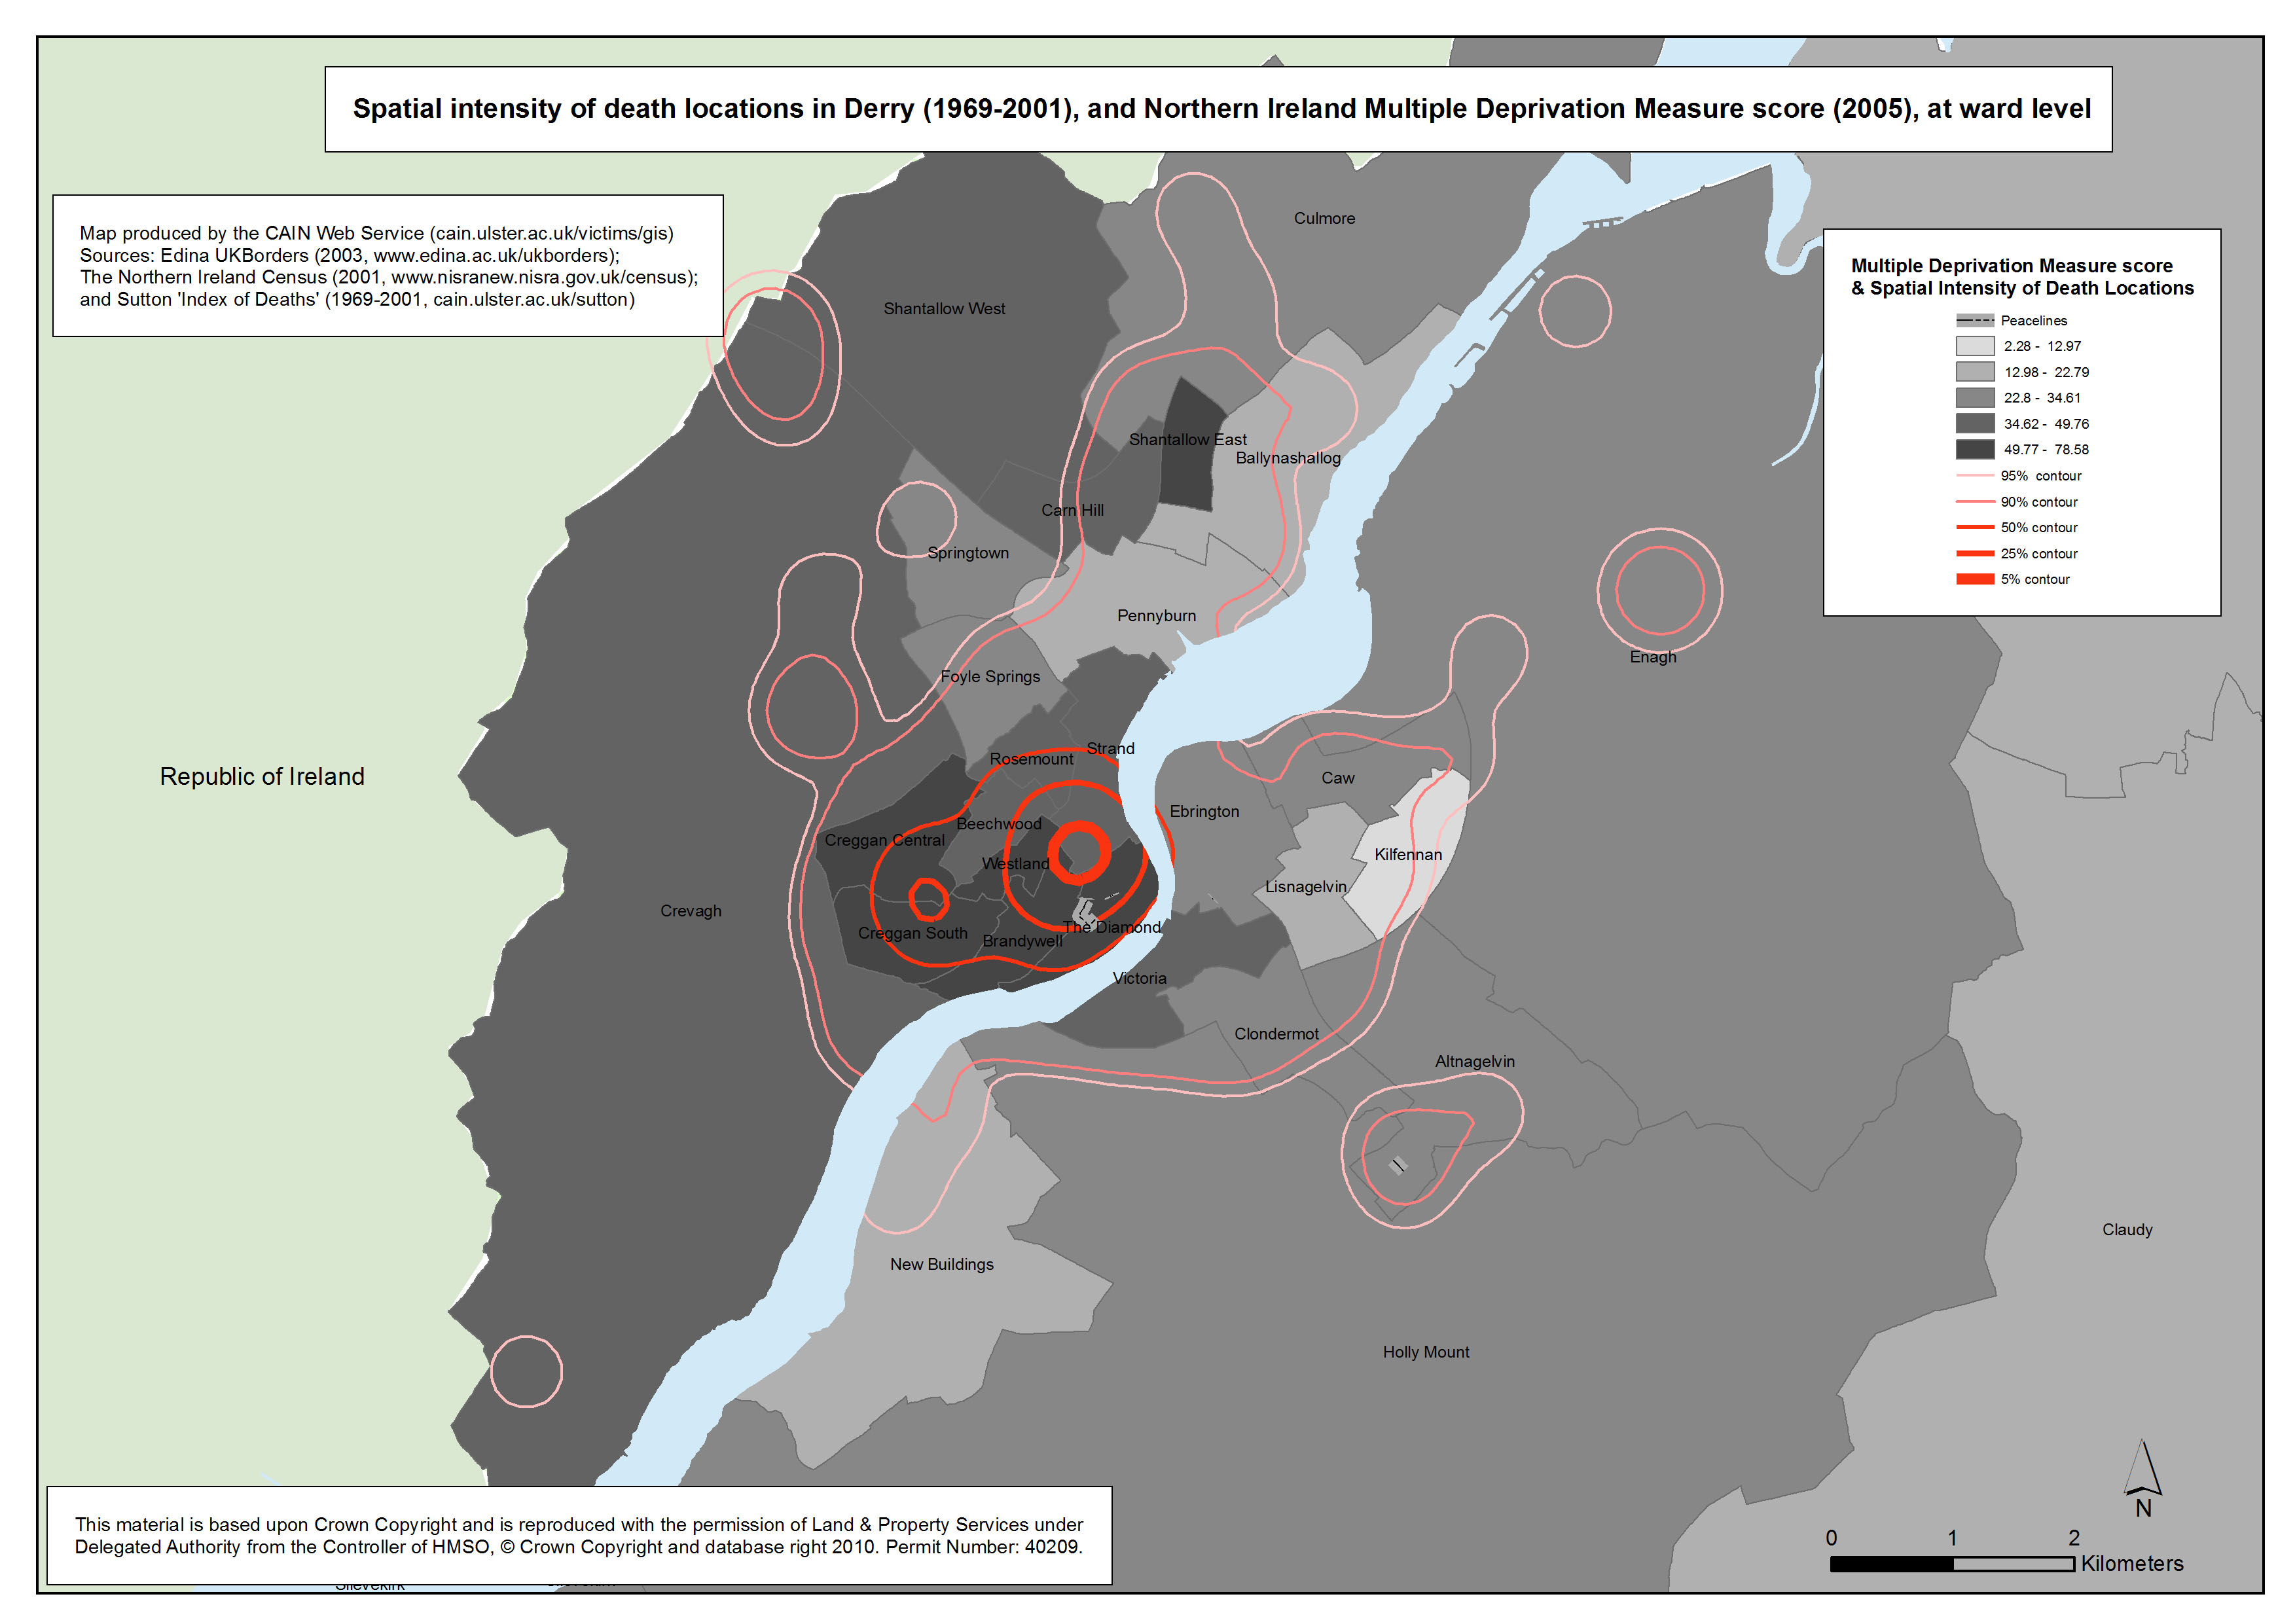
Spatial Intensity Maps - Death locations (1969-2001), by area (Belfast, Derry) and Northern Ireland Multiple Deprivation Measure score (2005), at ward level
2 maps
 This pair of maps employ percent volume contours to identify the areas with the most intense incidents of deaths due to the conflict in Belfast and Derry between 1969 and 2001. The information used to locate and plot each death is provided by Malcolm Sutton’s “Index of Deaths 1969-2001” (http://www.cain.ulster.ac.uk/sutton/) . This pair of maps employ percent volume contours to identify the areas with the most intense incidents of deaths due to the conflict in Belfast and Derry between 1969 and 2001. The information used to locate and plot each death is provided by Malcolm Sutton’s “Index of Deaths 1969-2001” (http://www.cain.ulster.ac.uk/sutton/) .
5 levels of contours are employed. The 5% level of contour, indicated by the thickest contour line, overlays the area with the most intense number of deaths in each map.
The ‘peacelines’ erected during the troubles with the intention of minimising conflict at interface areas are identified and located. The peacelines shapefile was downloaded from the Northern Ireland Statistics and Research Agency. (http://www.nisra.gov.uk/geography/default.asp12.htm)
The Northern Ireland Multiple Deprivation Measure (NIMDM) 2005 score for each ward is also mapped. The NIMDM is a combination of seven types or 'domains' of deprivation:
- Income Deprivation 25%
- Employment Deprivation 25%
- Health Deprivation and Disability 15%
- Education, Skills and Training Deprivation 15%
- Proximity to Services 10%
- Living Environment 5%
- Crime and Disorder 5%
The NIMDM was downloaded from the Northern Ireland Statistics and Research Agency
(http://www.ninis.nisra.gov.uk/mapxtreme_deprivation2005/datacatalogue.asp?button=ward).
| Spatial Intensity Maps - Death locations (1969-2001), by area (Belfast, Derry) and Northern Ireland Multiple Deprivation Measure score (2005), at ward level (2 maps compiled and drawn by Luke Kelleher) |
| Title of Map |
File Version |
| PDF
| L-JPG
| H-JPG
|
Spatial Intensity Map - Belfast - Ward - MDM
Spatial intensity of death locations in Belfast (1969-2001), and Northern Ireland Multiple Deprivation Measure score 92005), at ward level. |
.pdf
514kb |
.jpg
158kb |
.jpg
961kb |
 Spatial Intensity Map - Derry - Ward - MDM Spatial Intensity Map - Derry - Ward - MDM
Spatial intensity of death locations in Derry (1969-2001), and Northern Ireland Multiple Deprivation Measure score 92005), at ward level. |
.pdf
395kb |
.jpg
114kb |
.jpg
665kb |
|
