
|
|
|
|
|
|
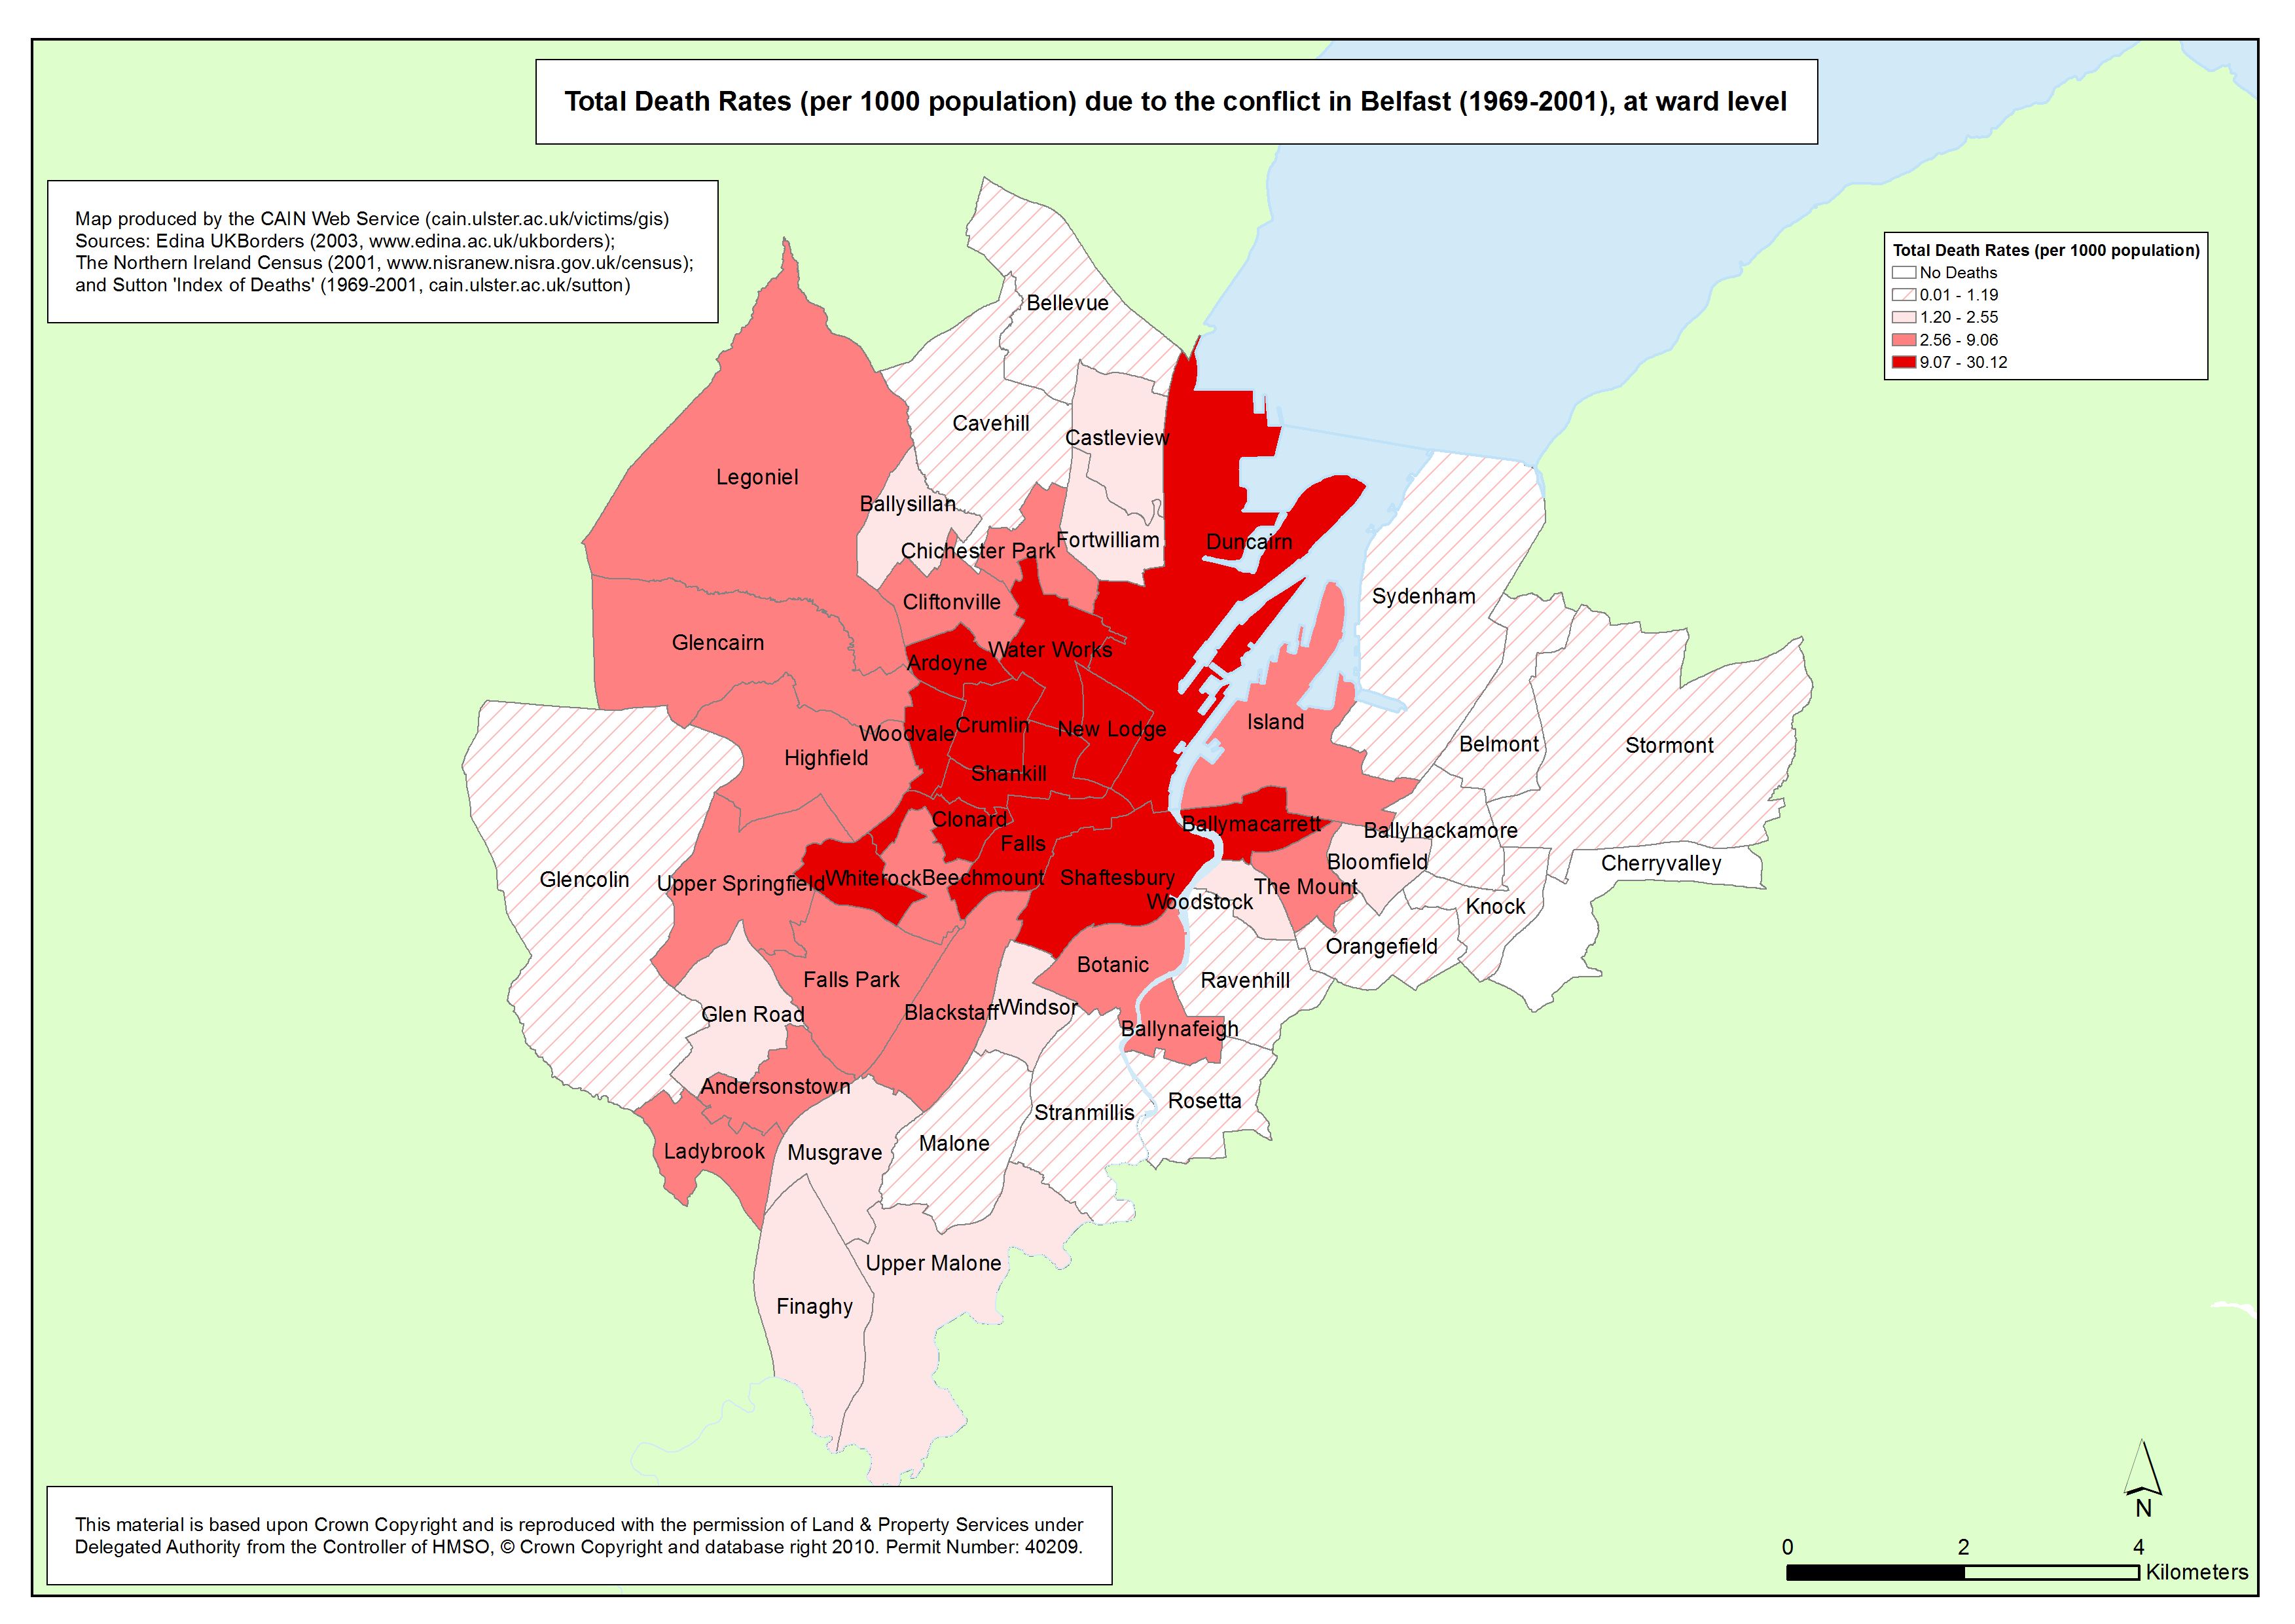
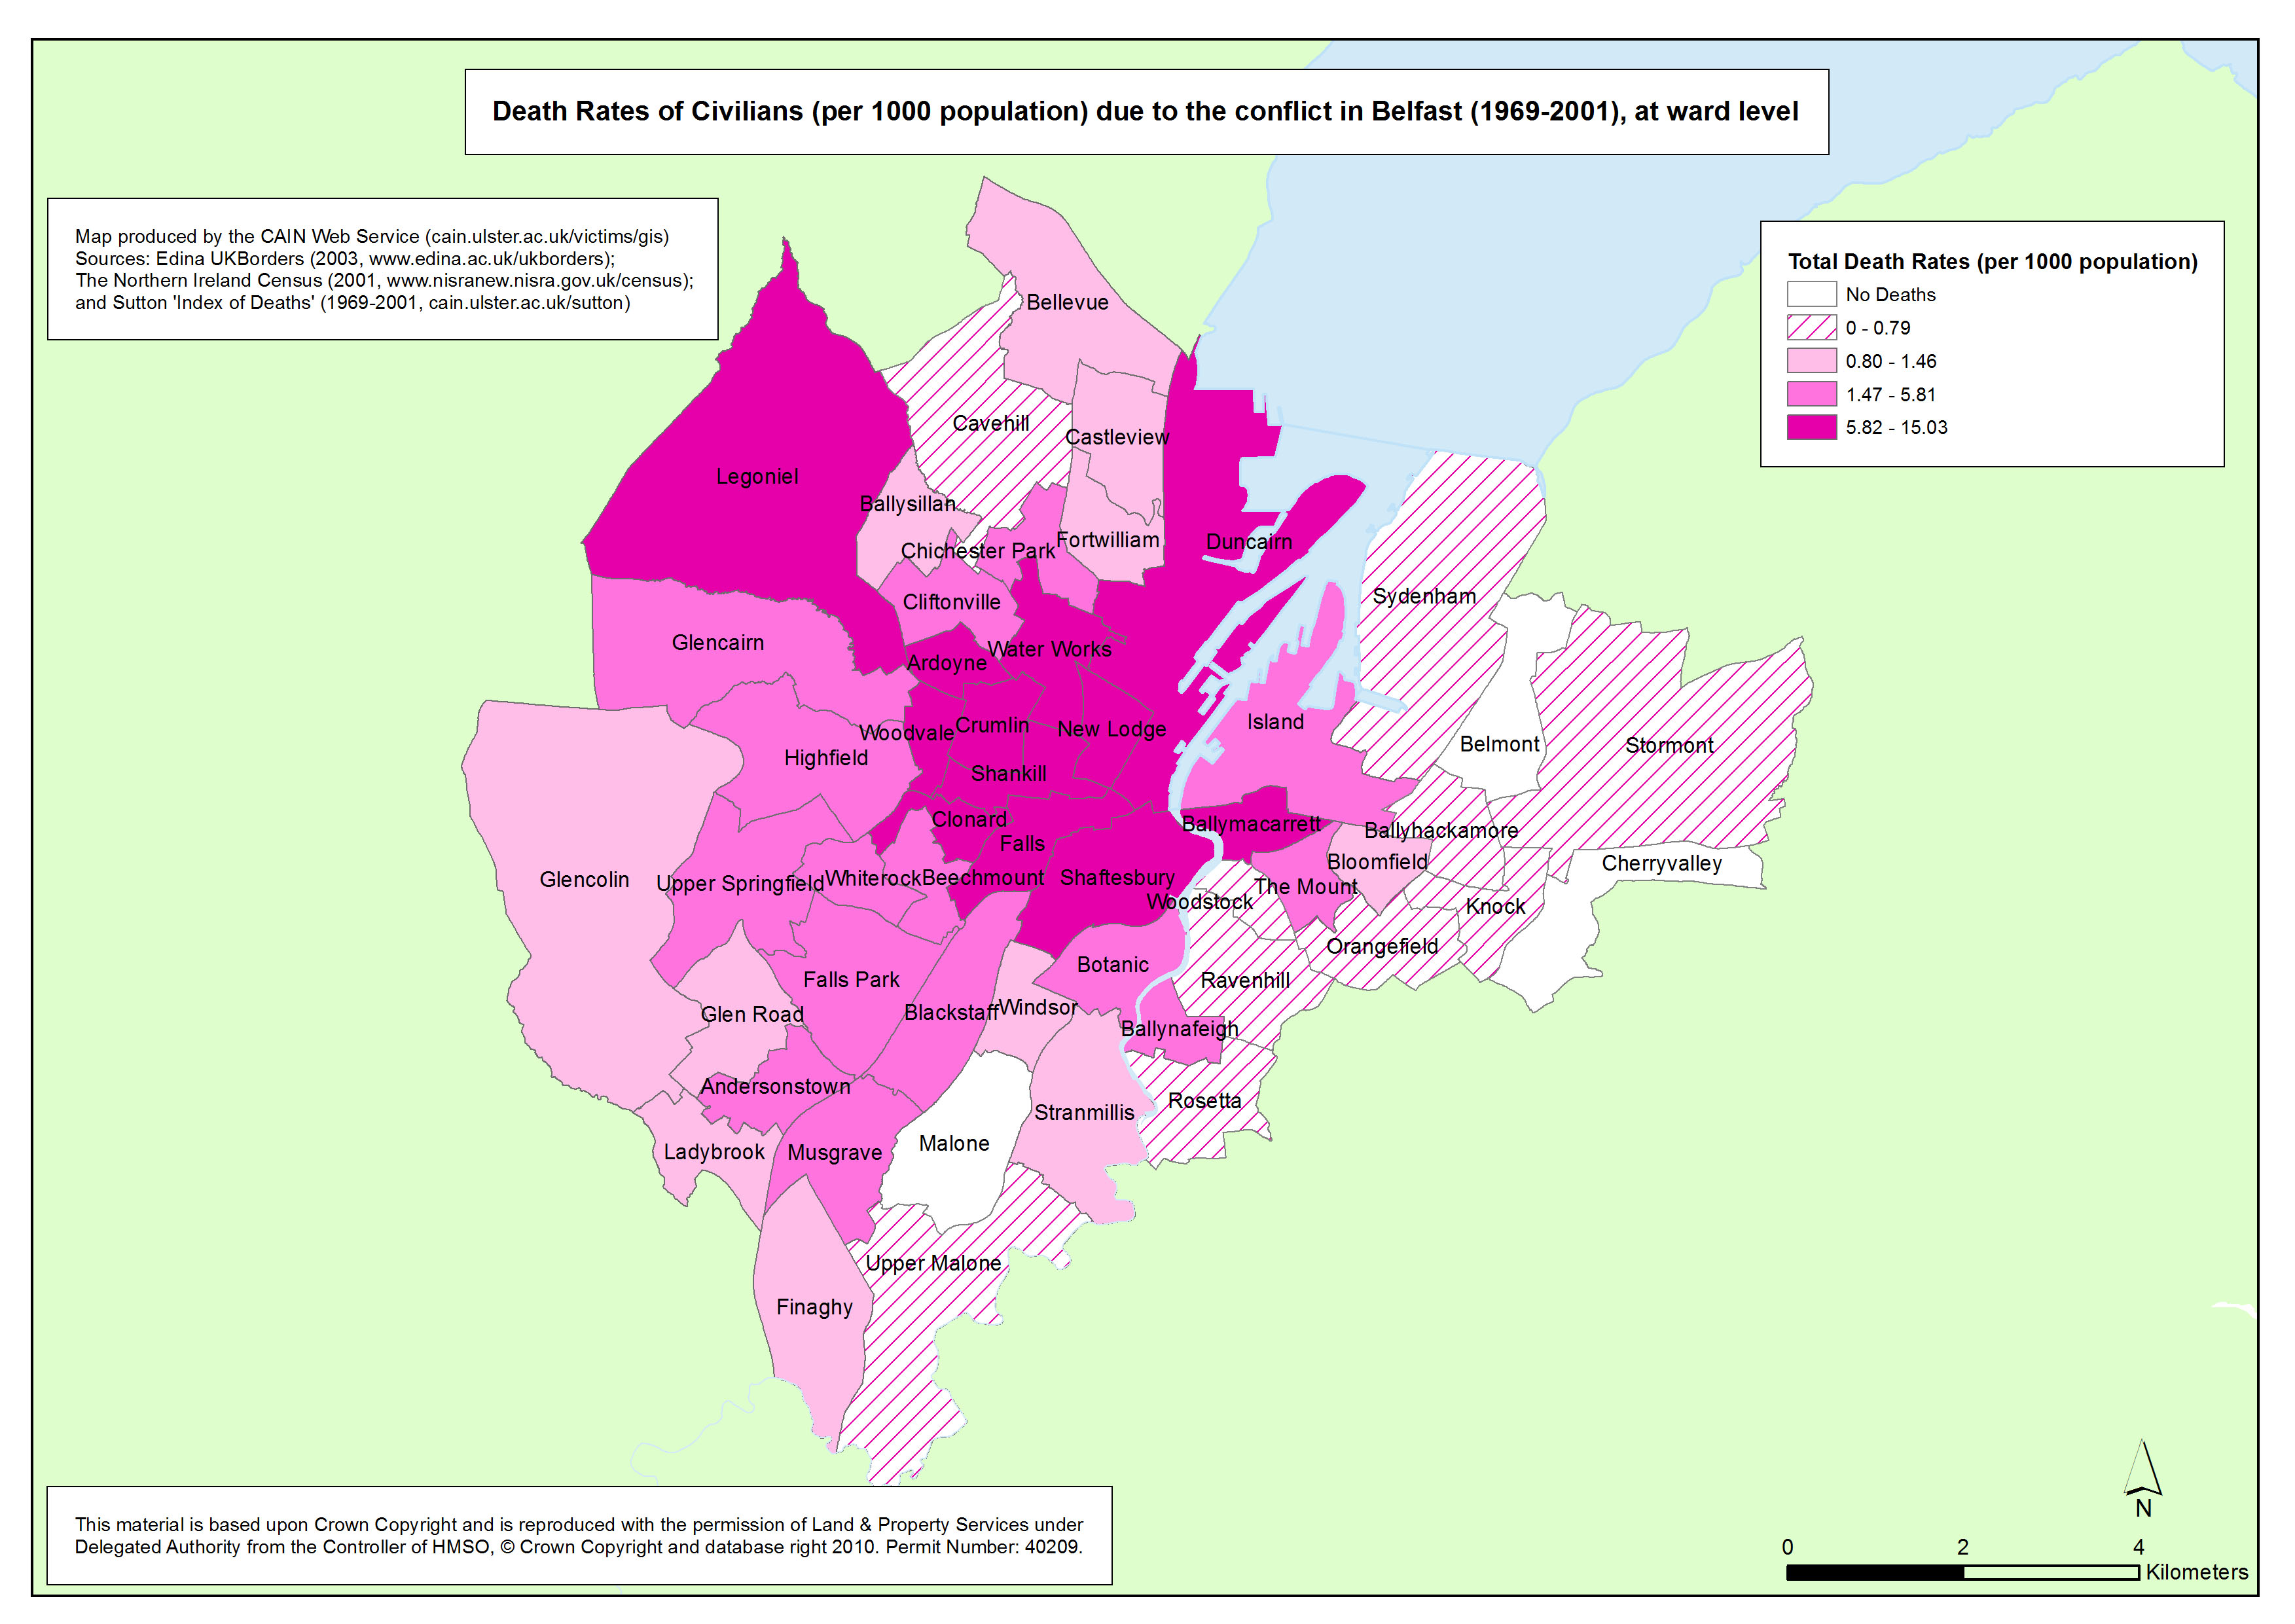
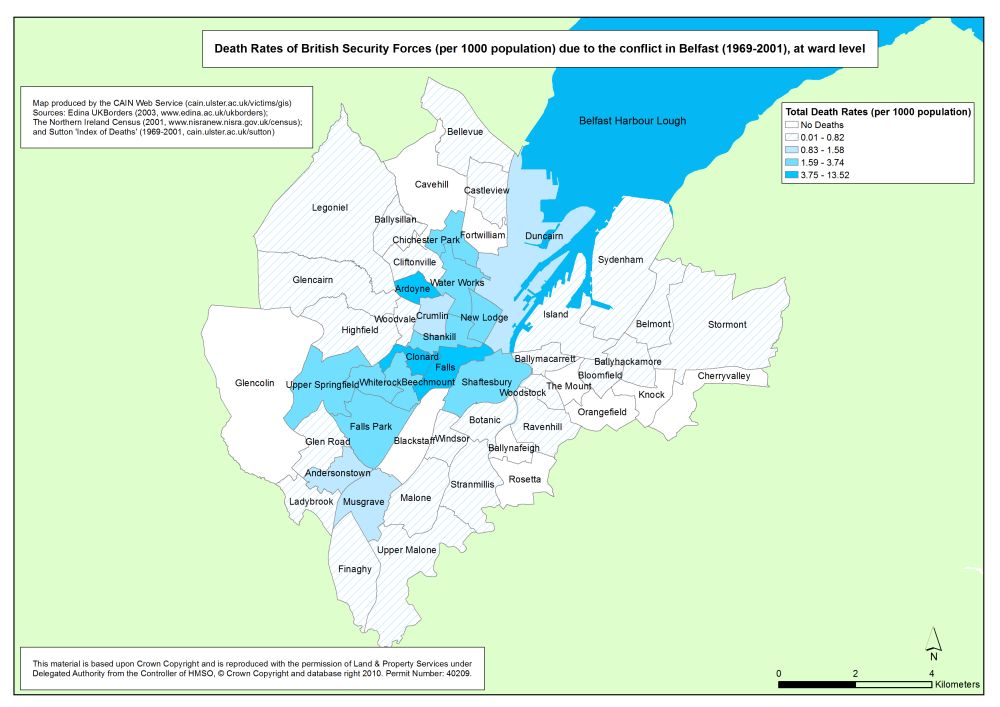
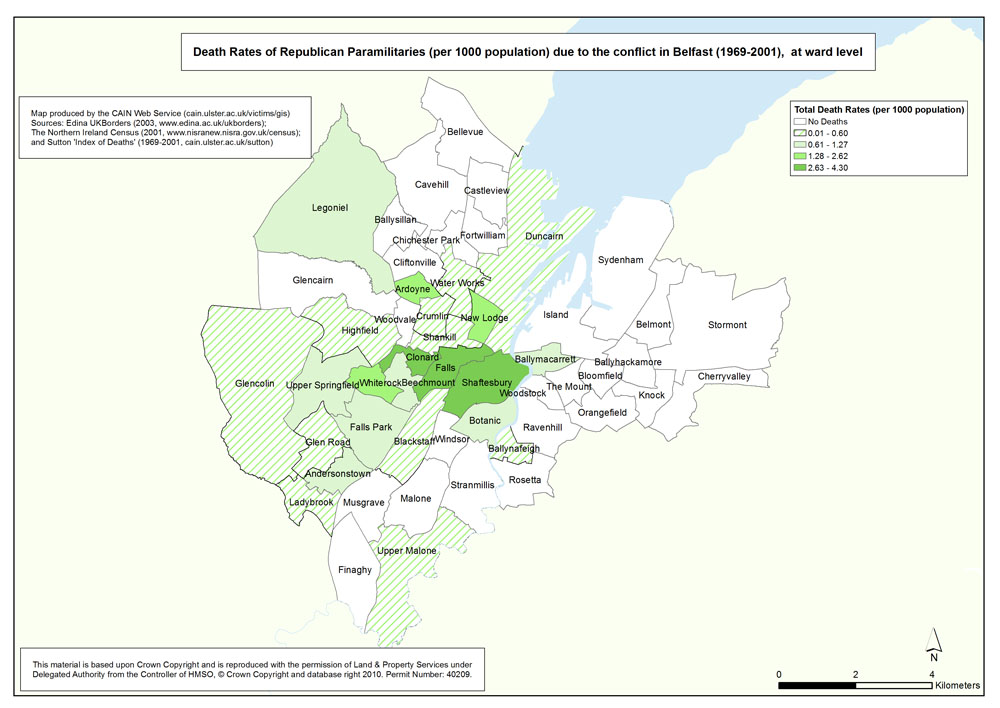
Maps - Deaths (1969-2001), by area (Northern Ireland, Belfast, Derry), and by status, at ward level (15 maps)
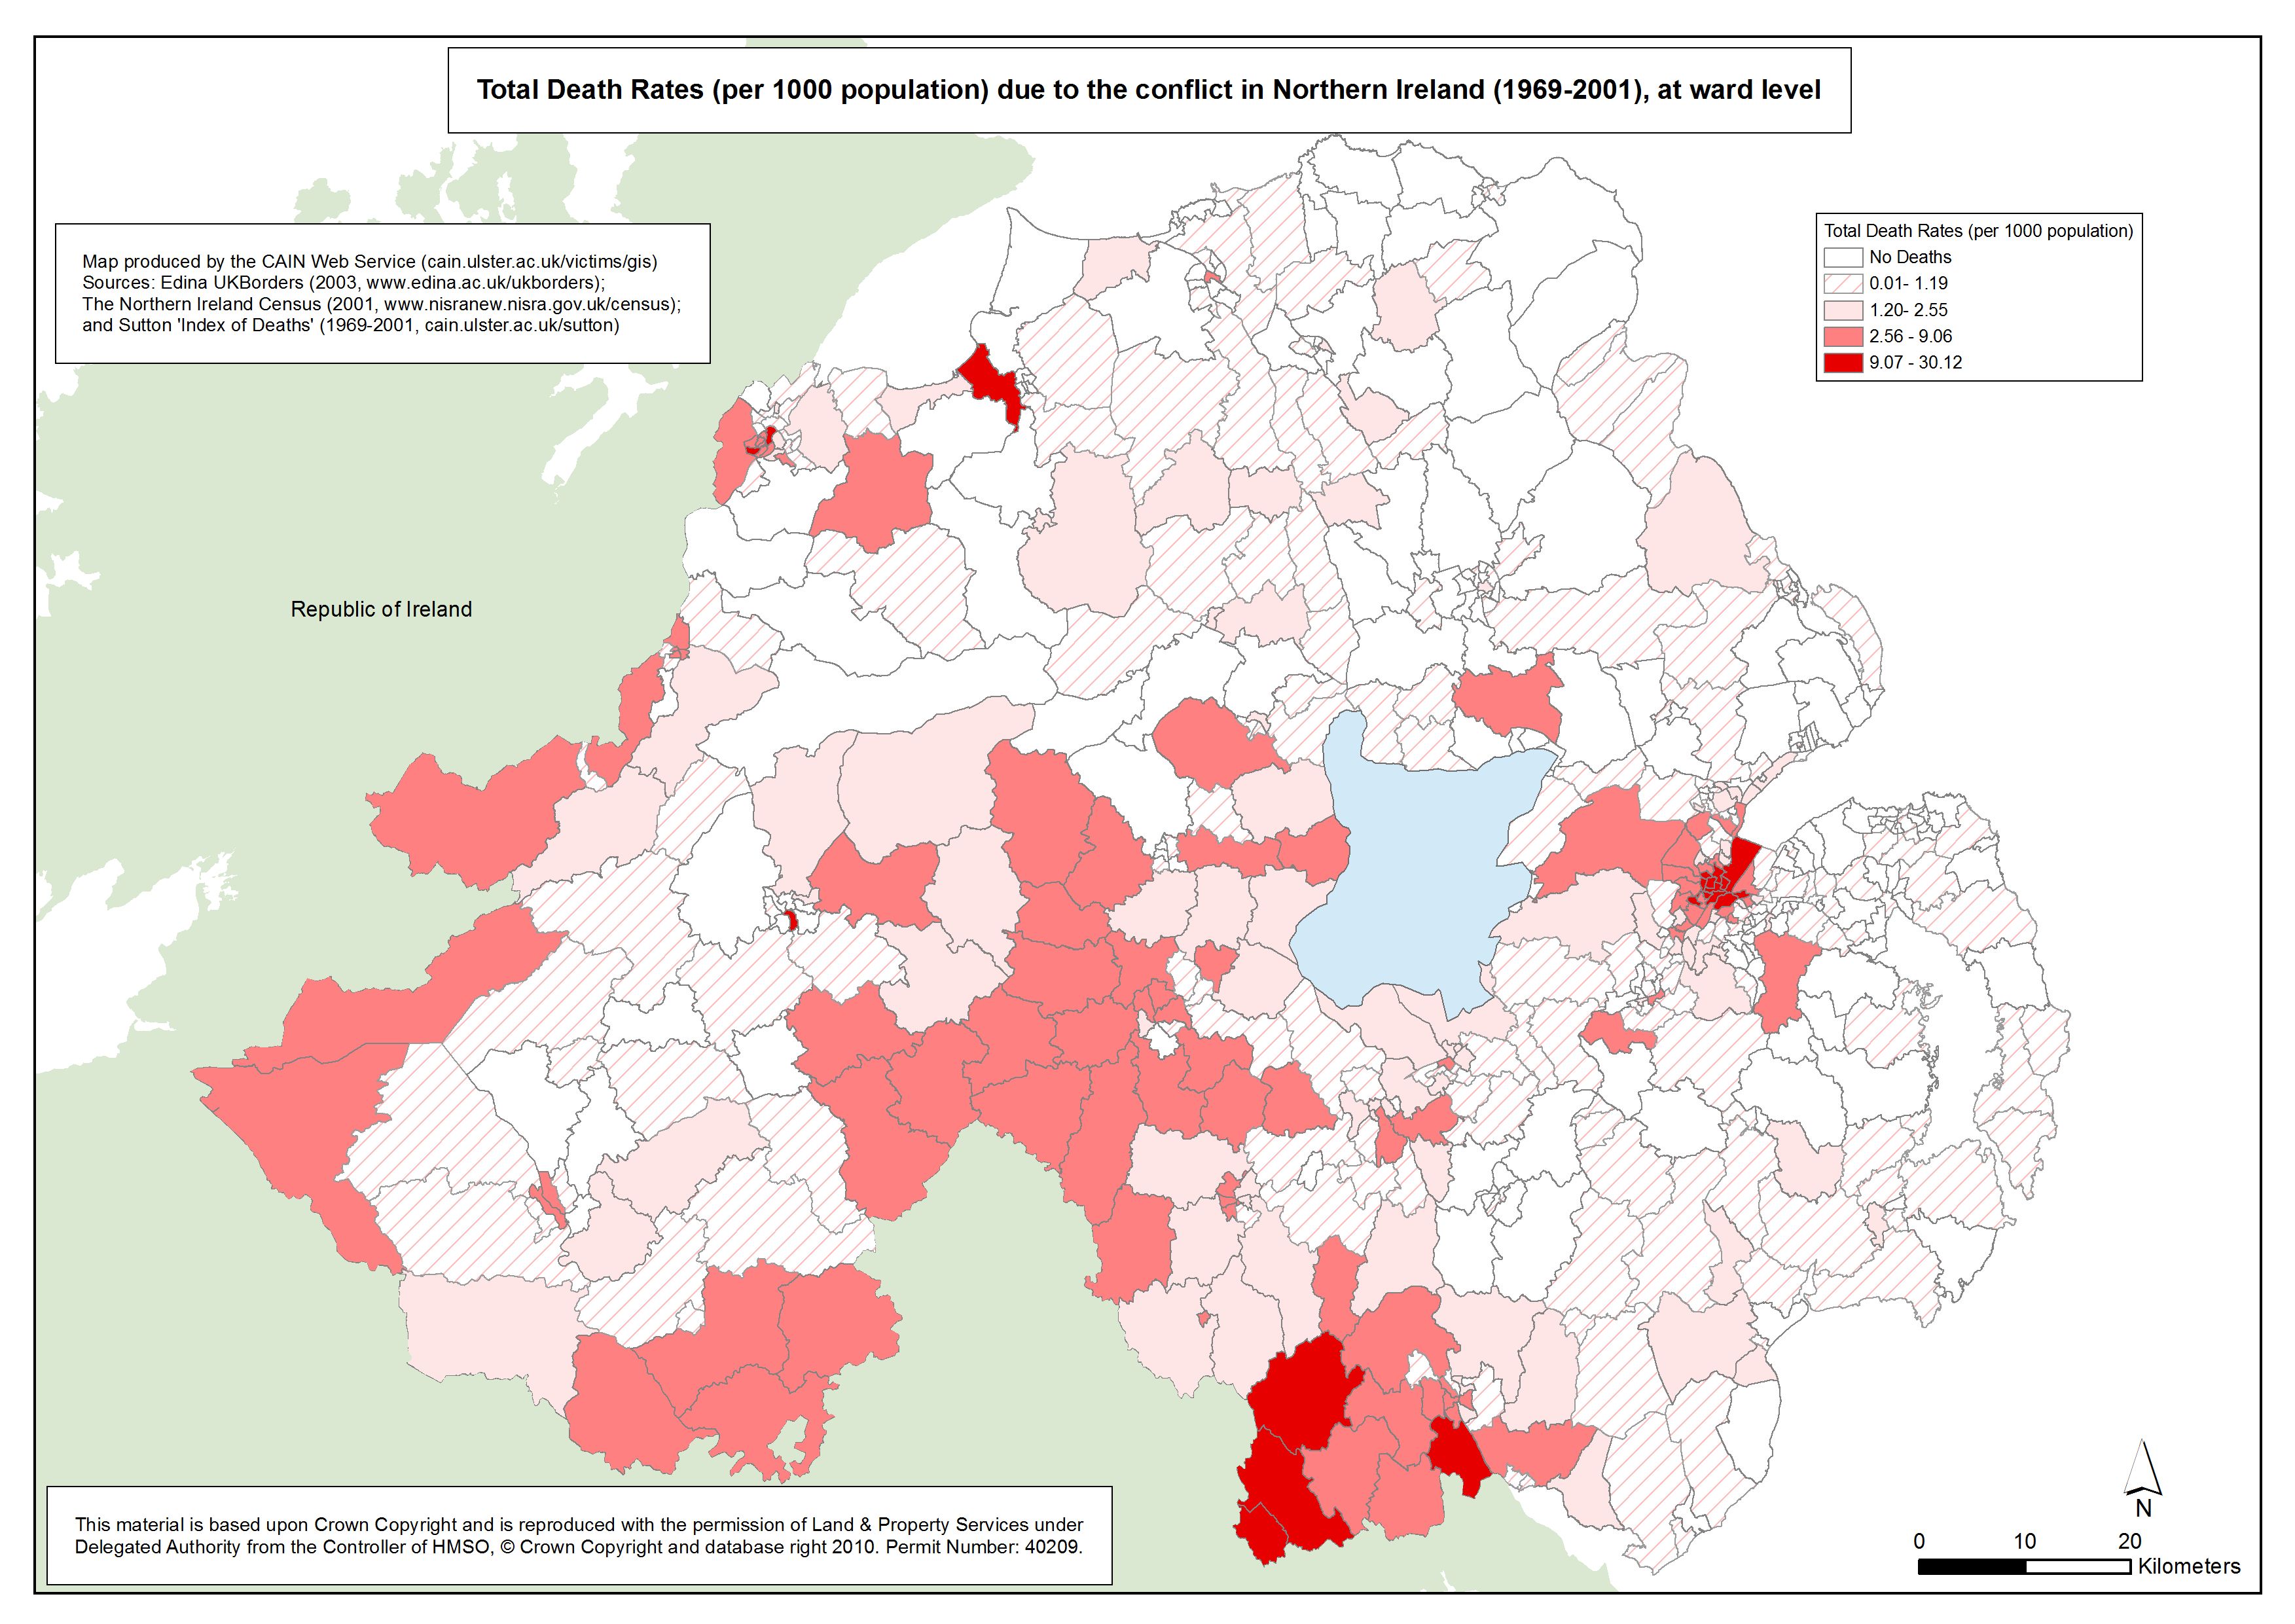
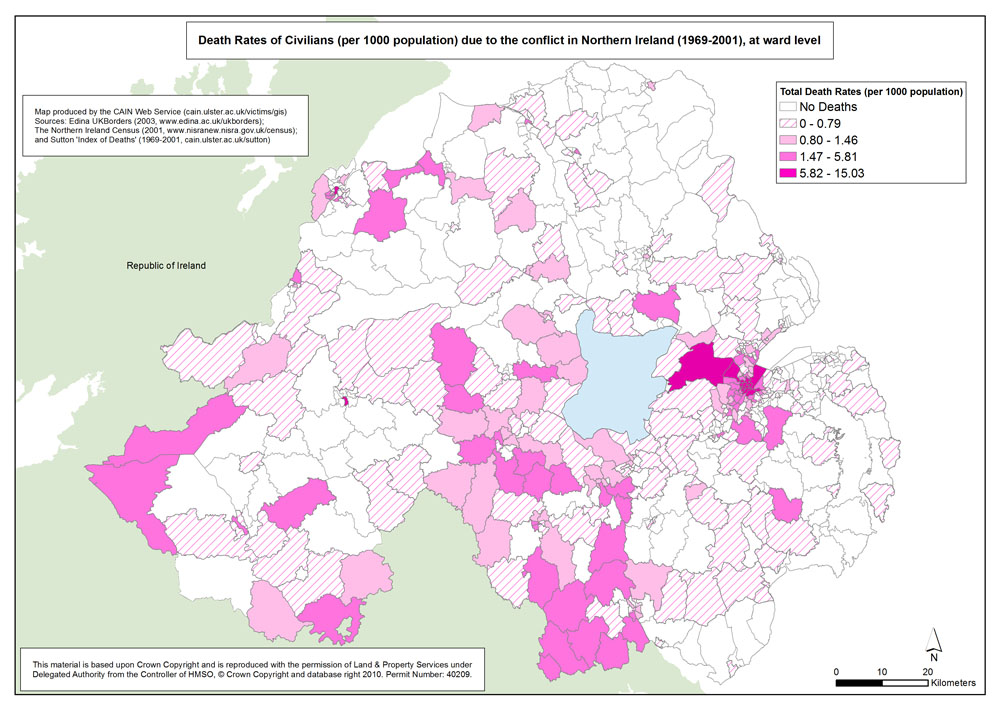
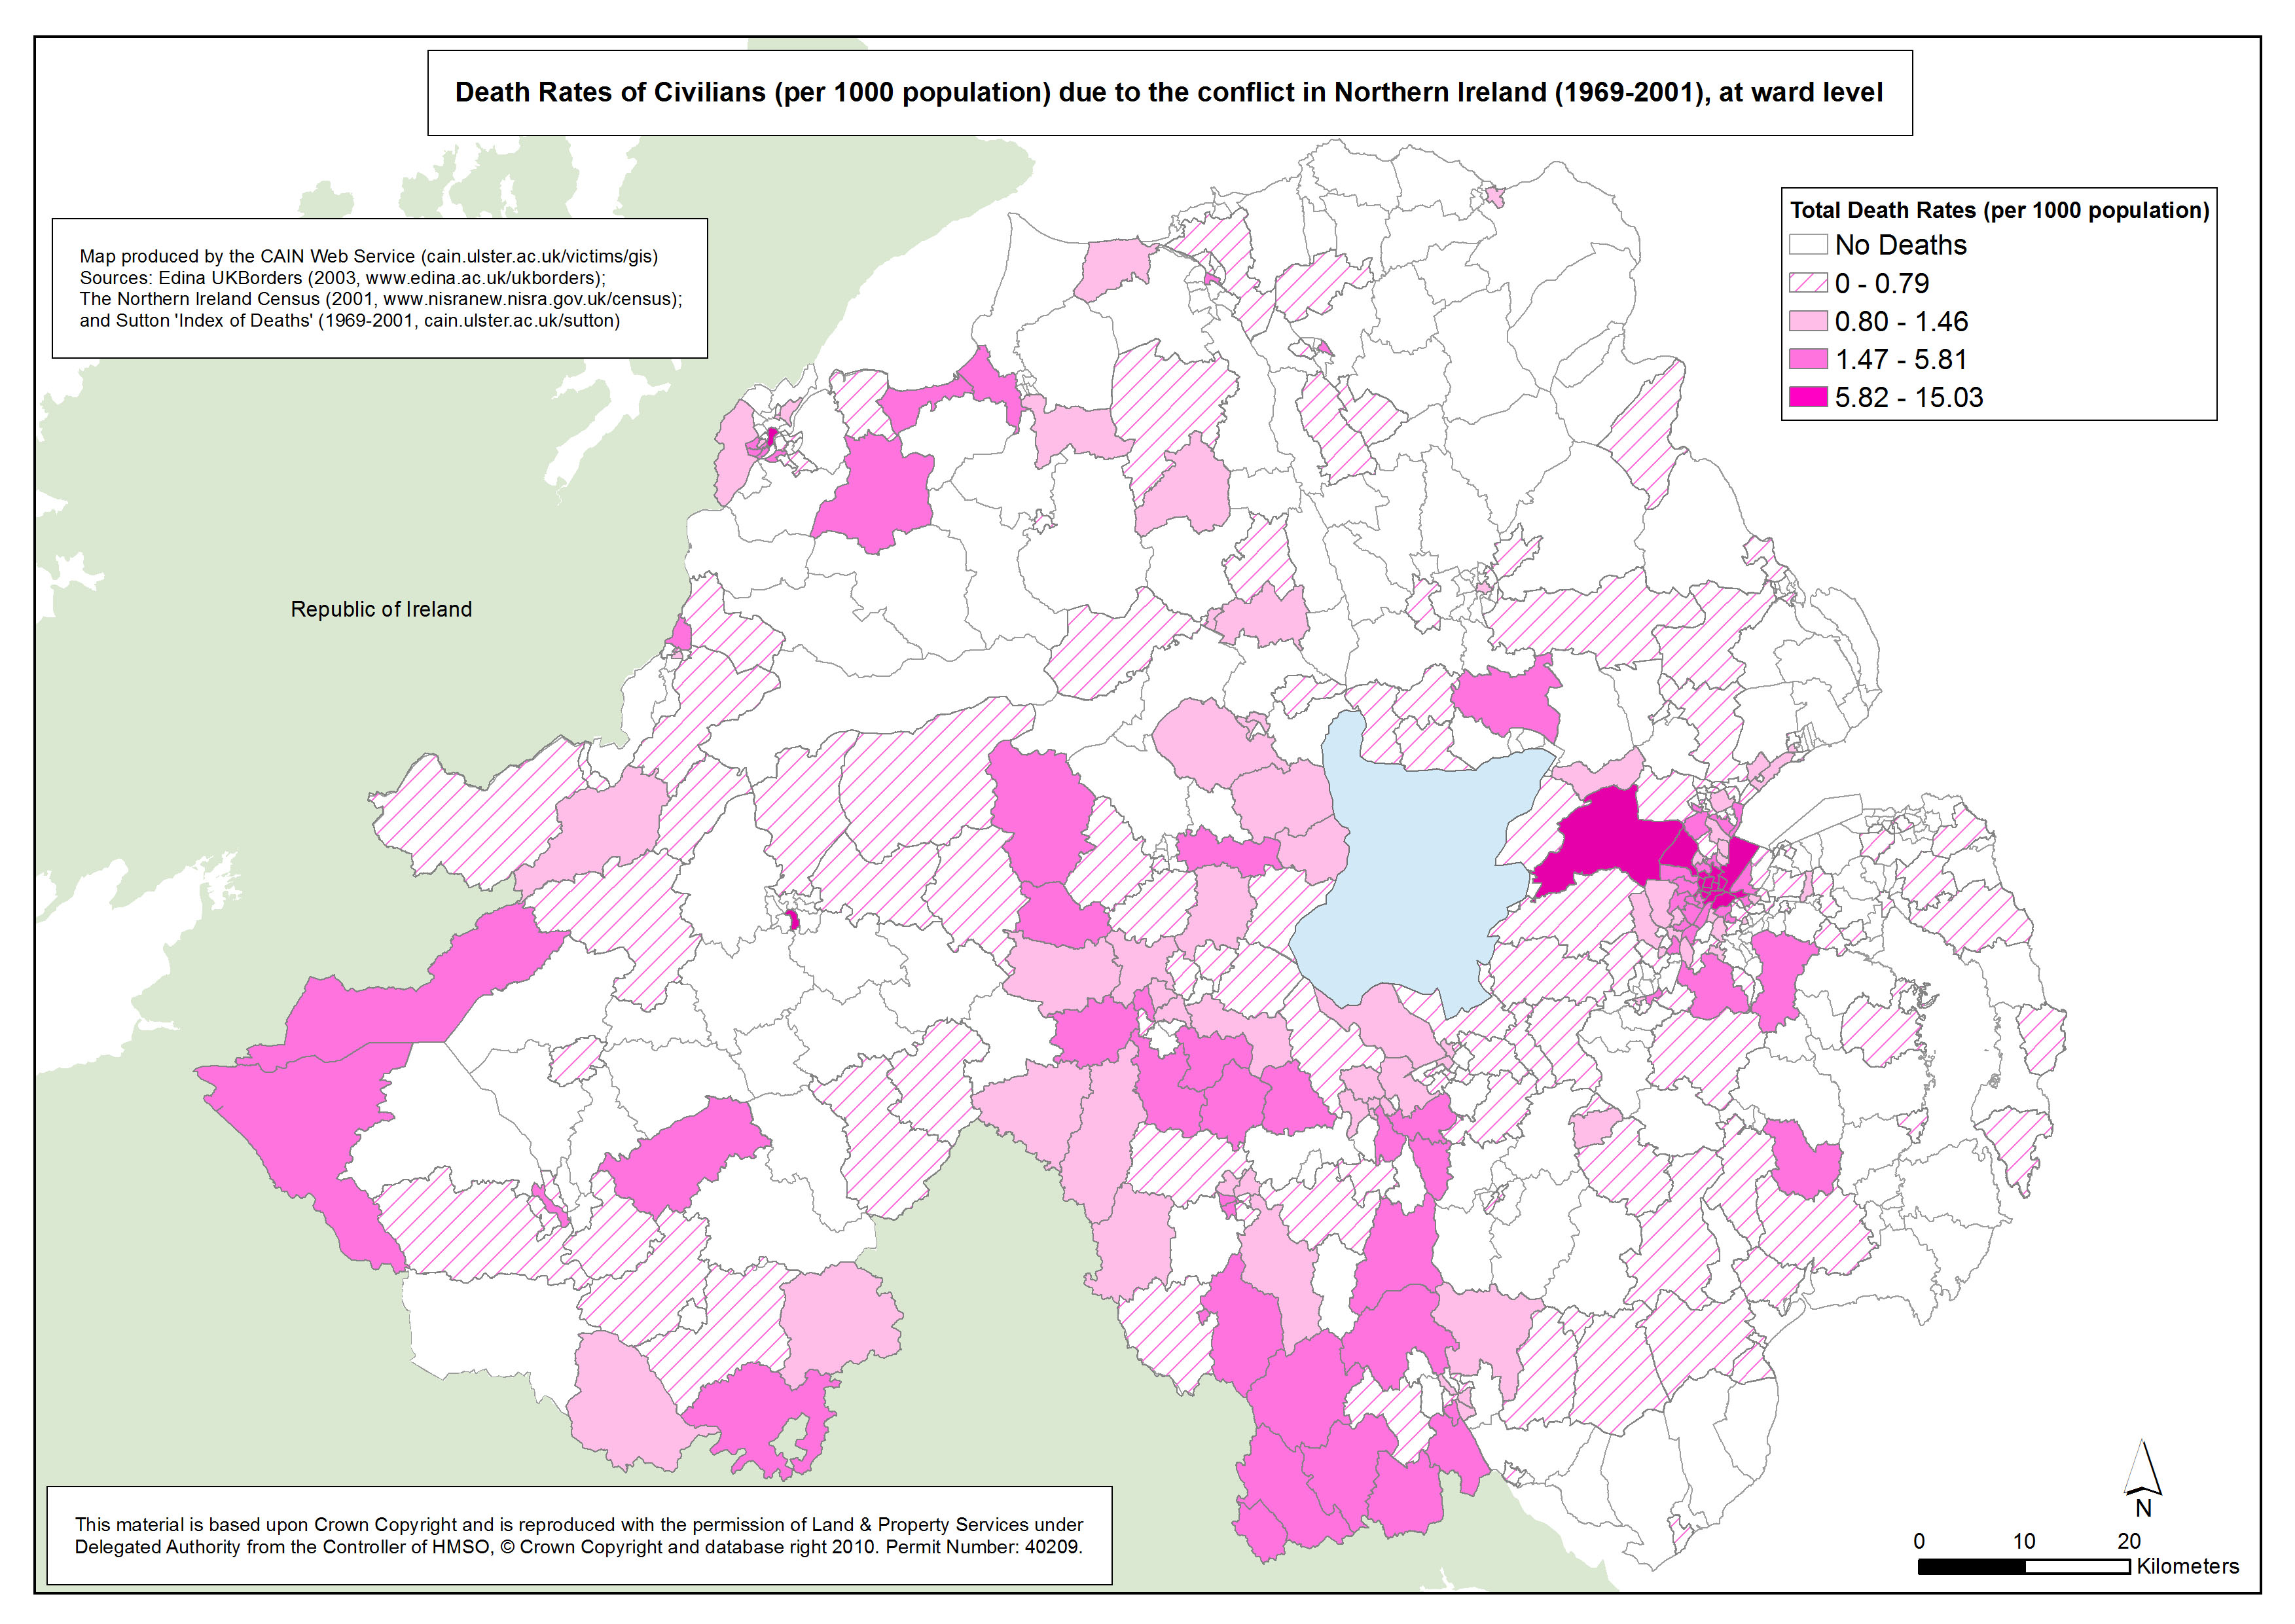
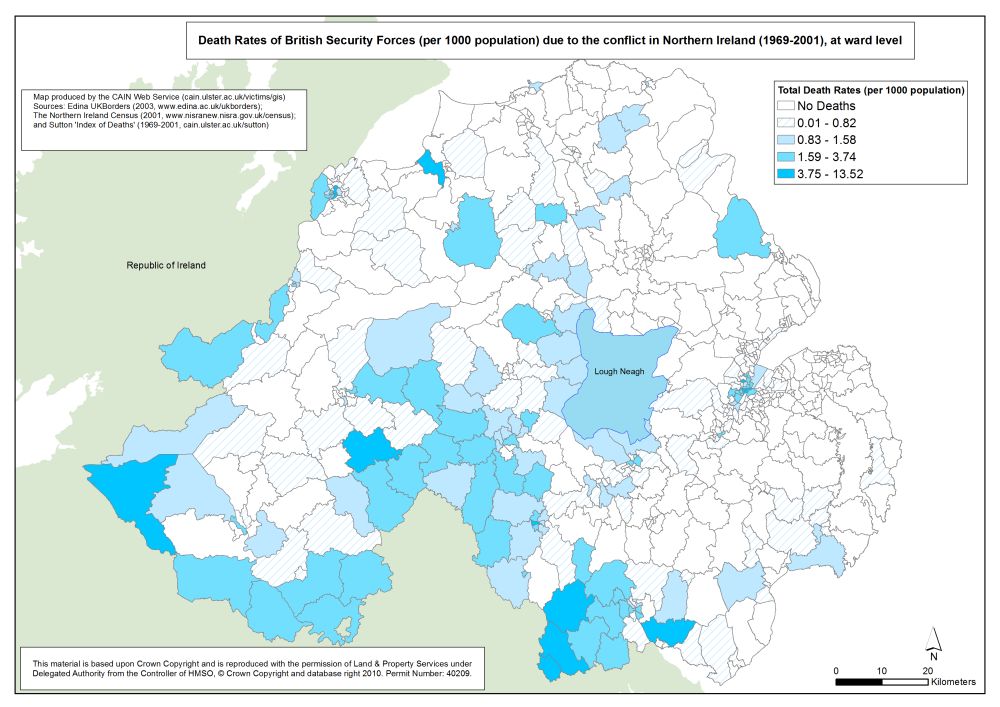
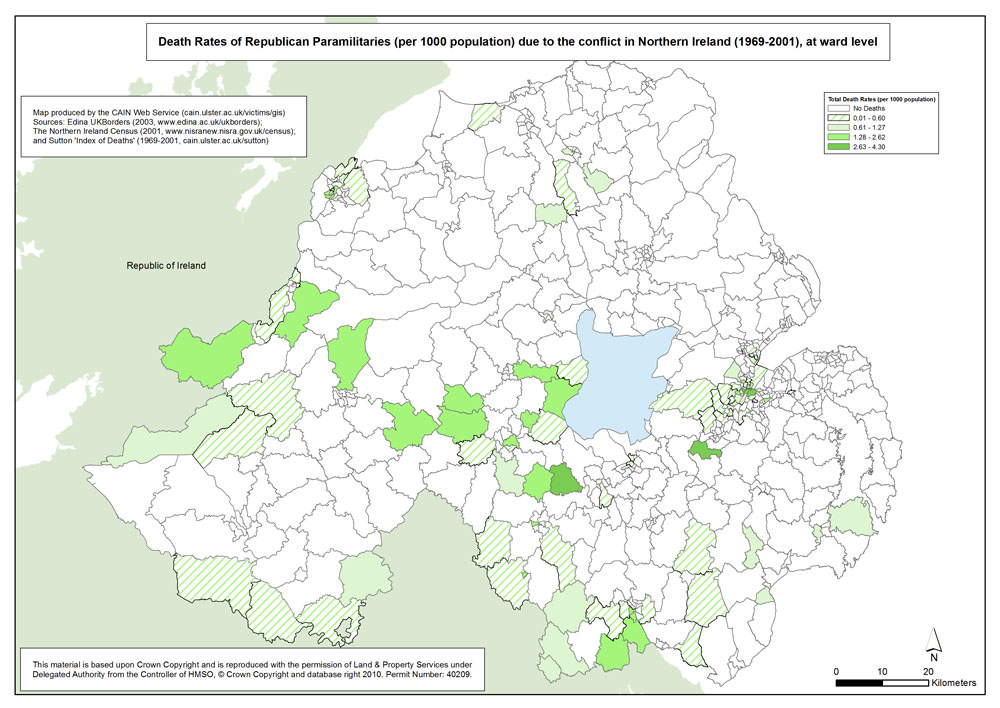
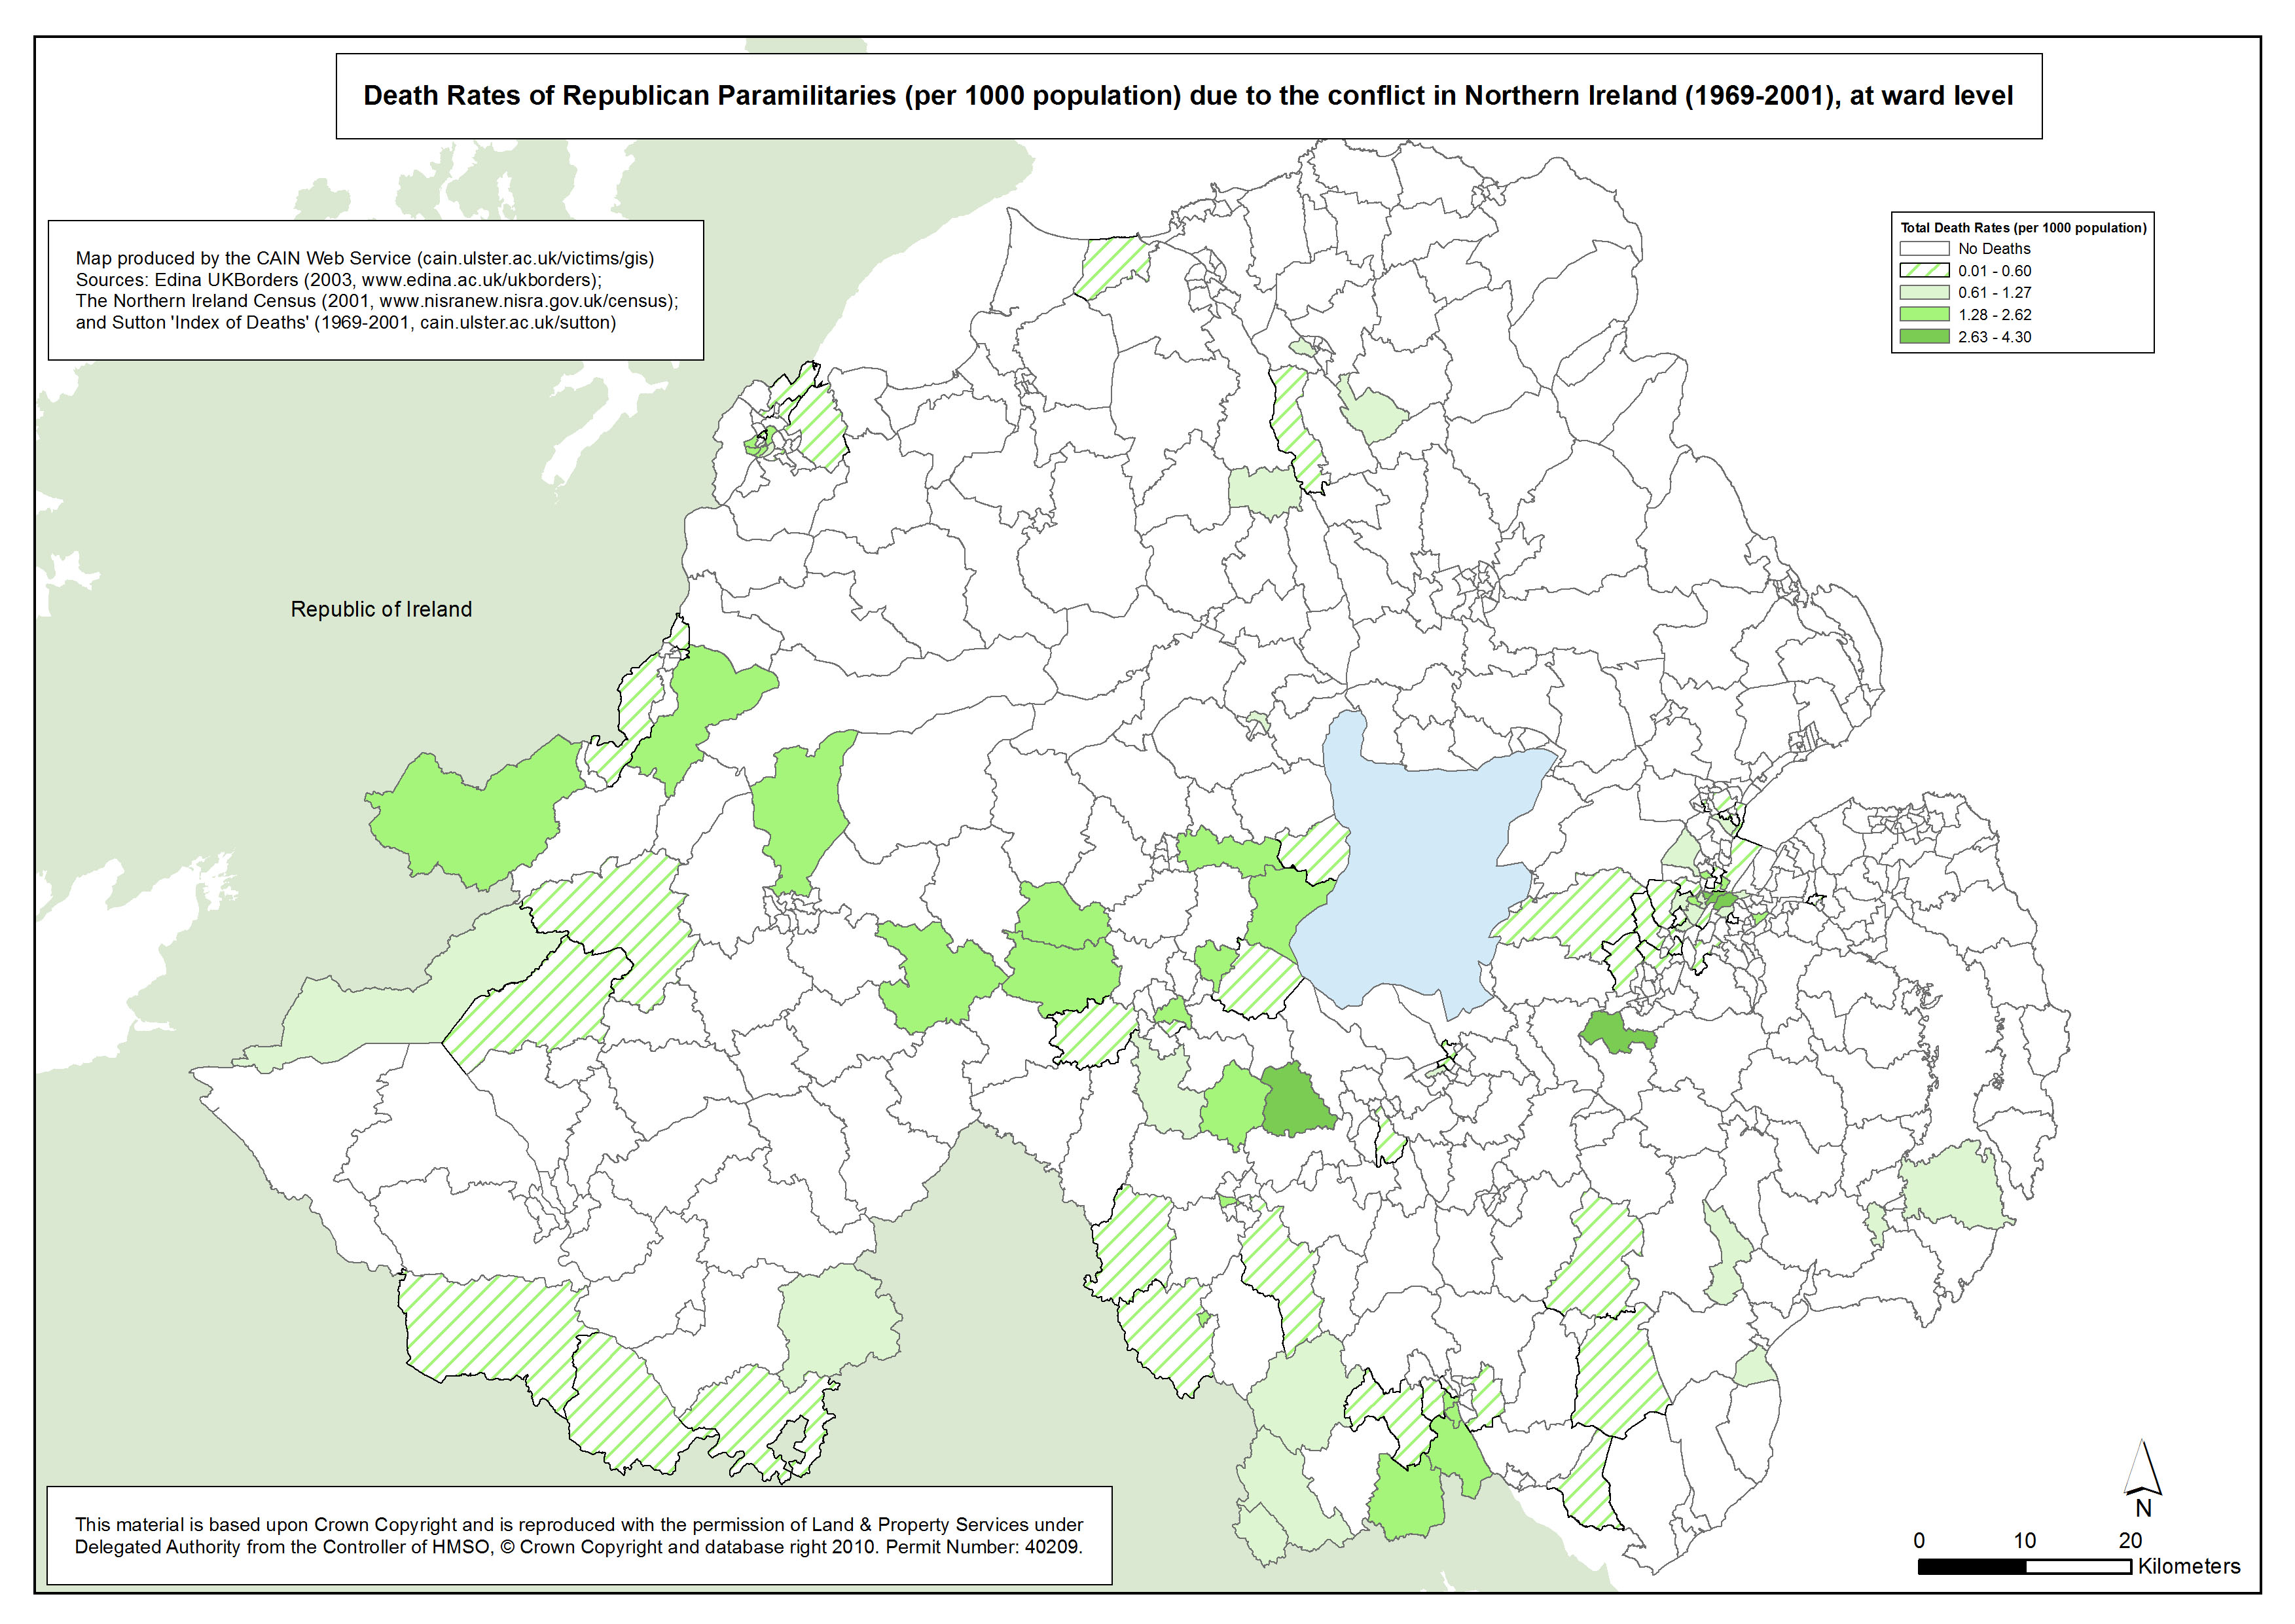
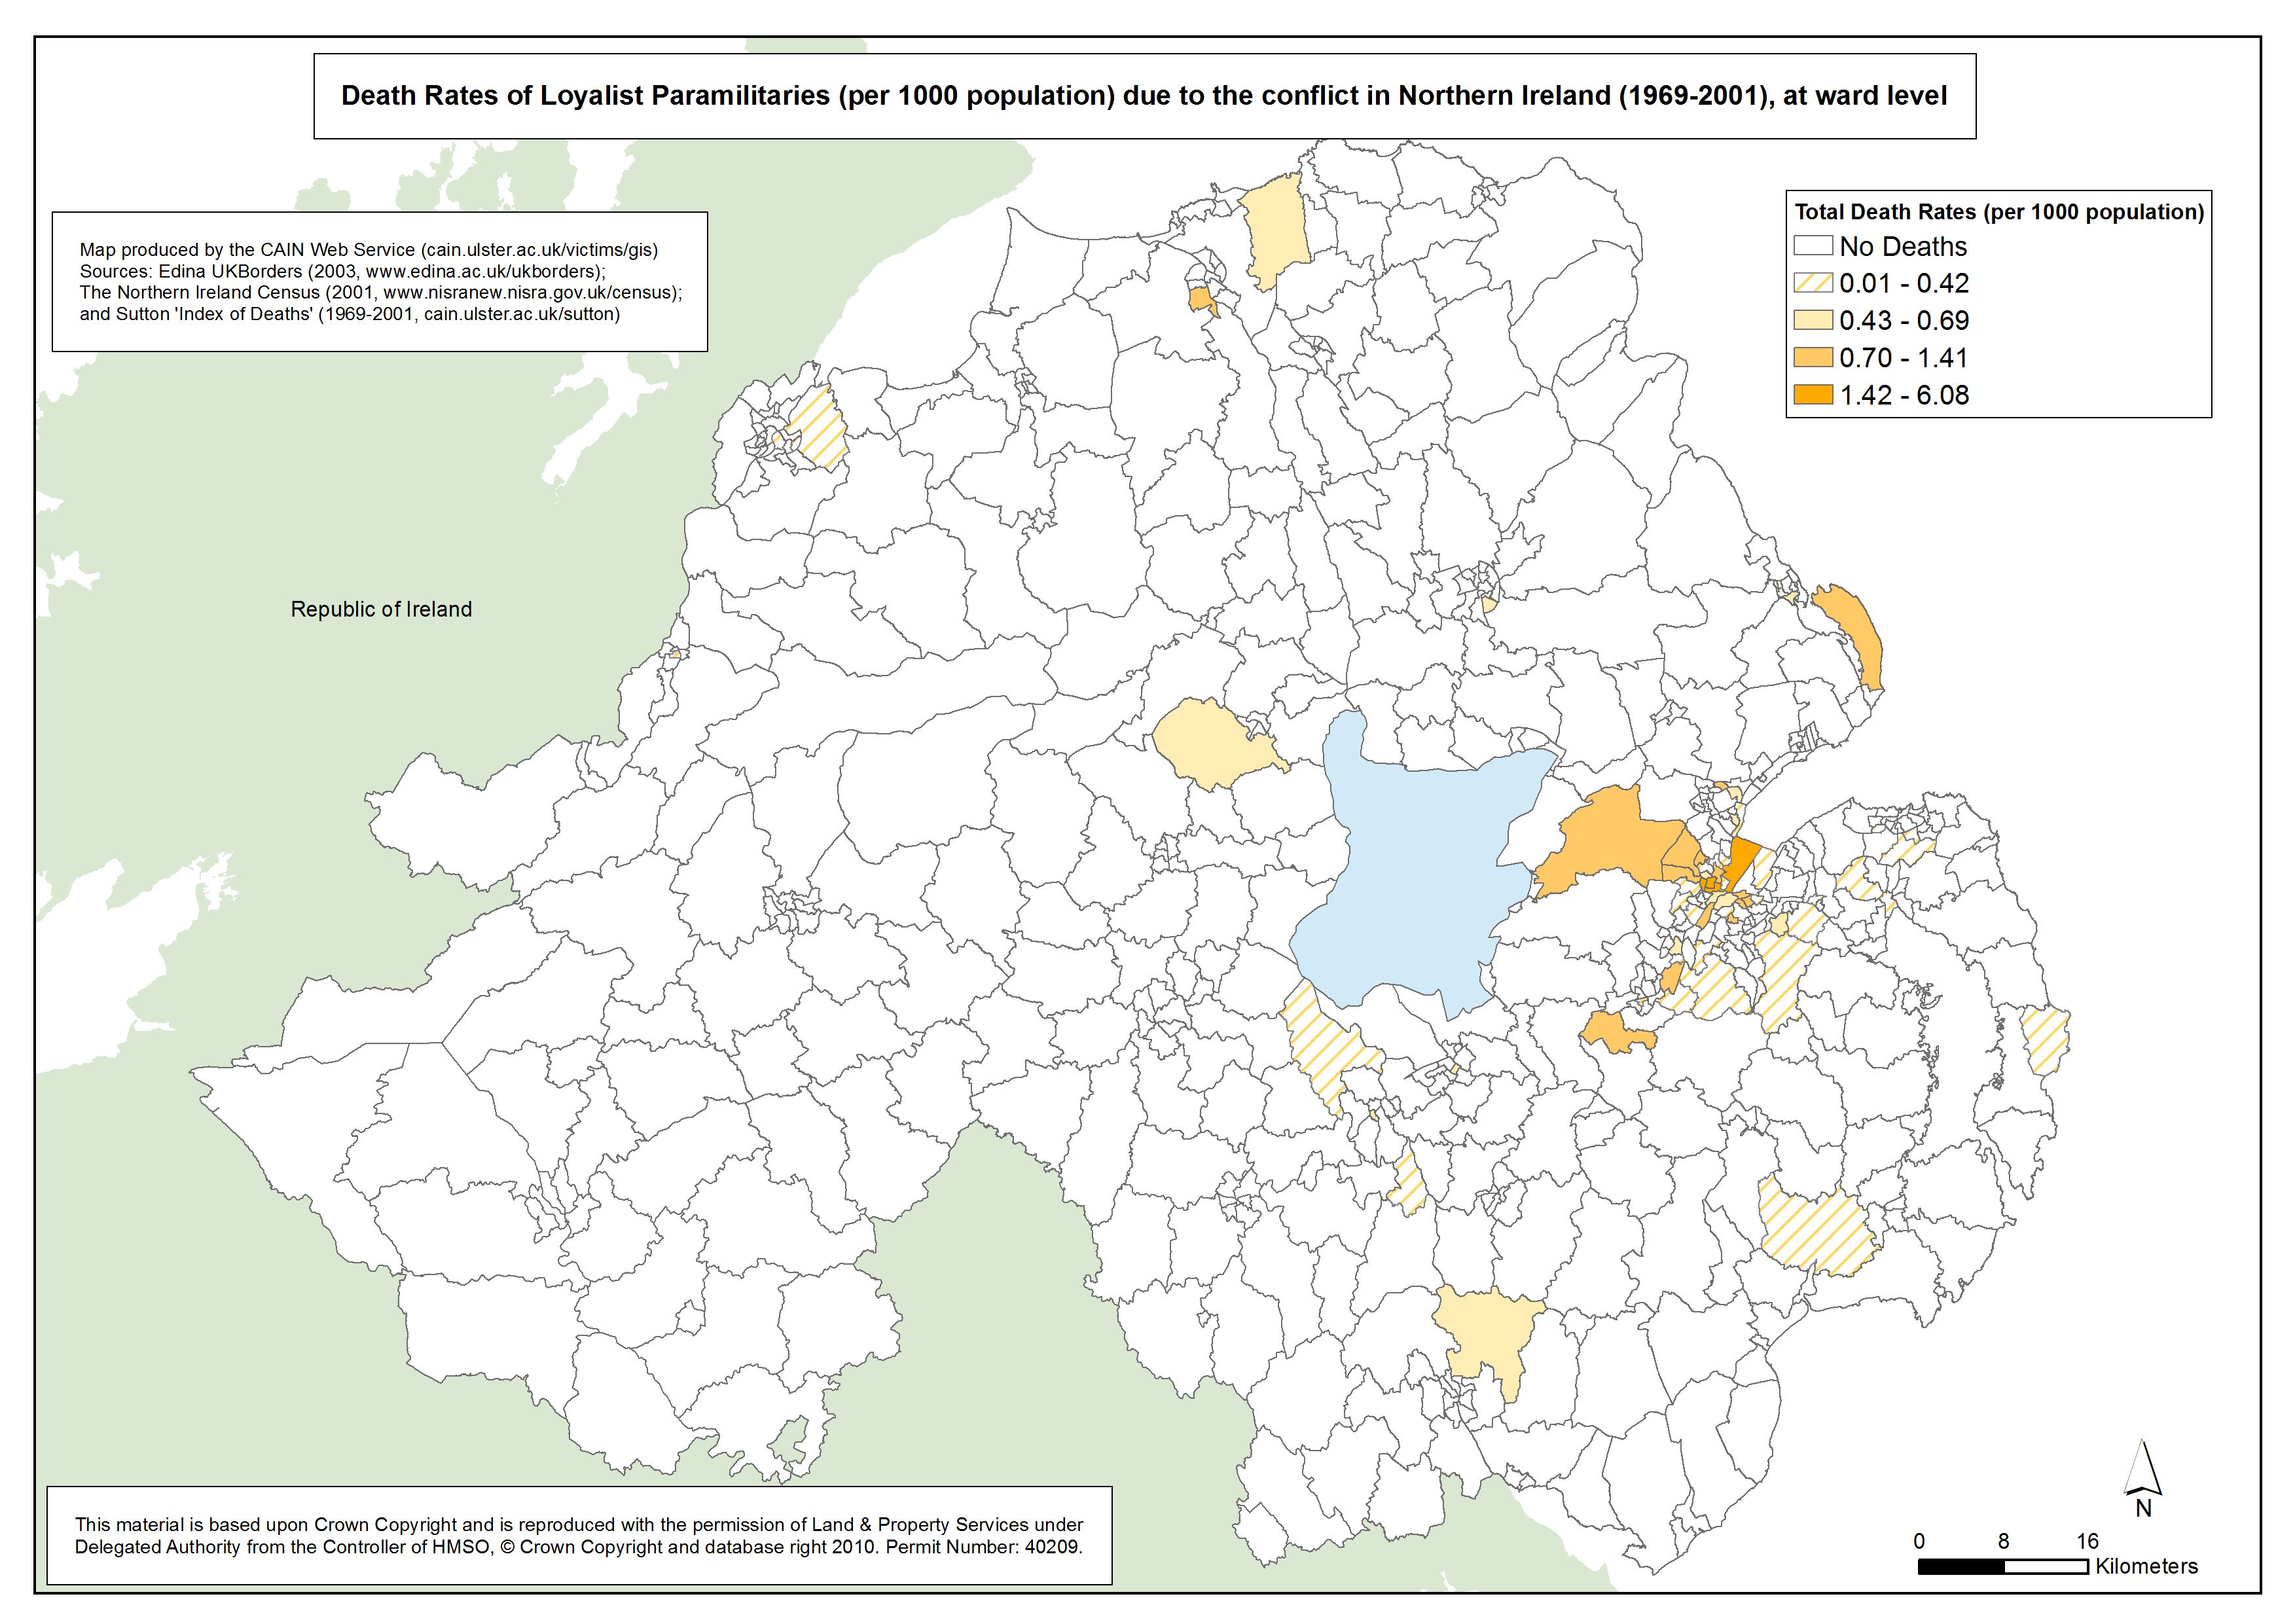
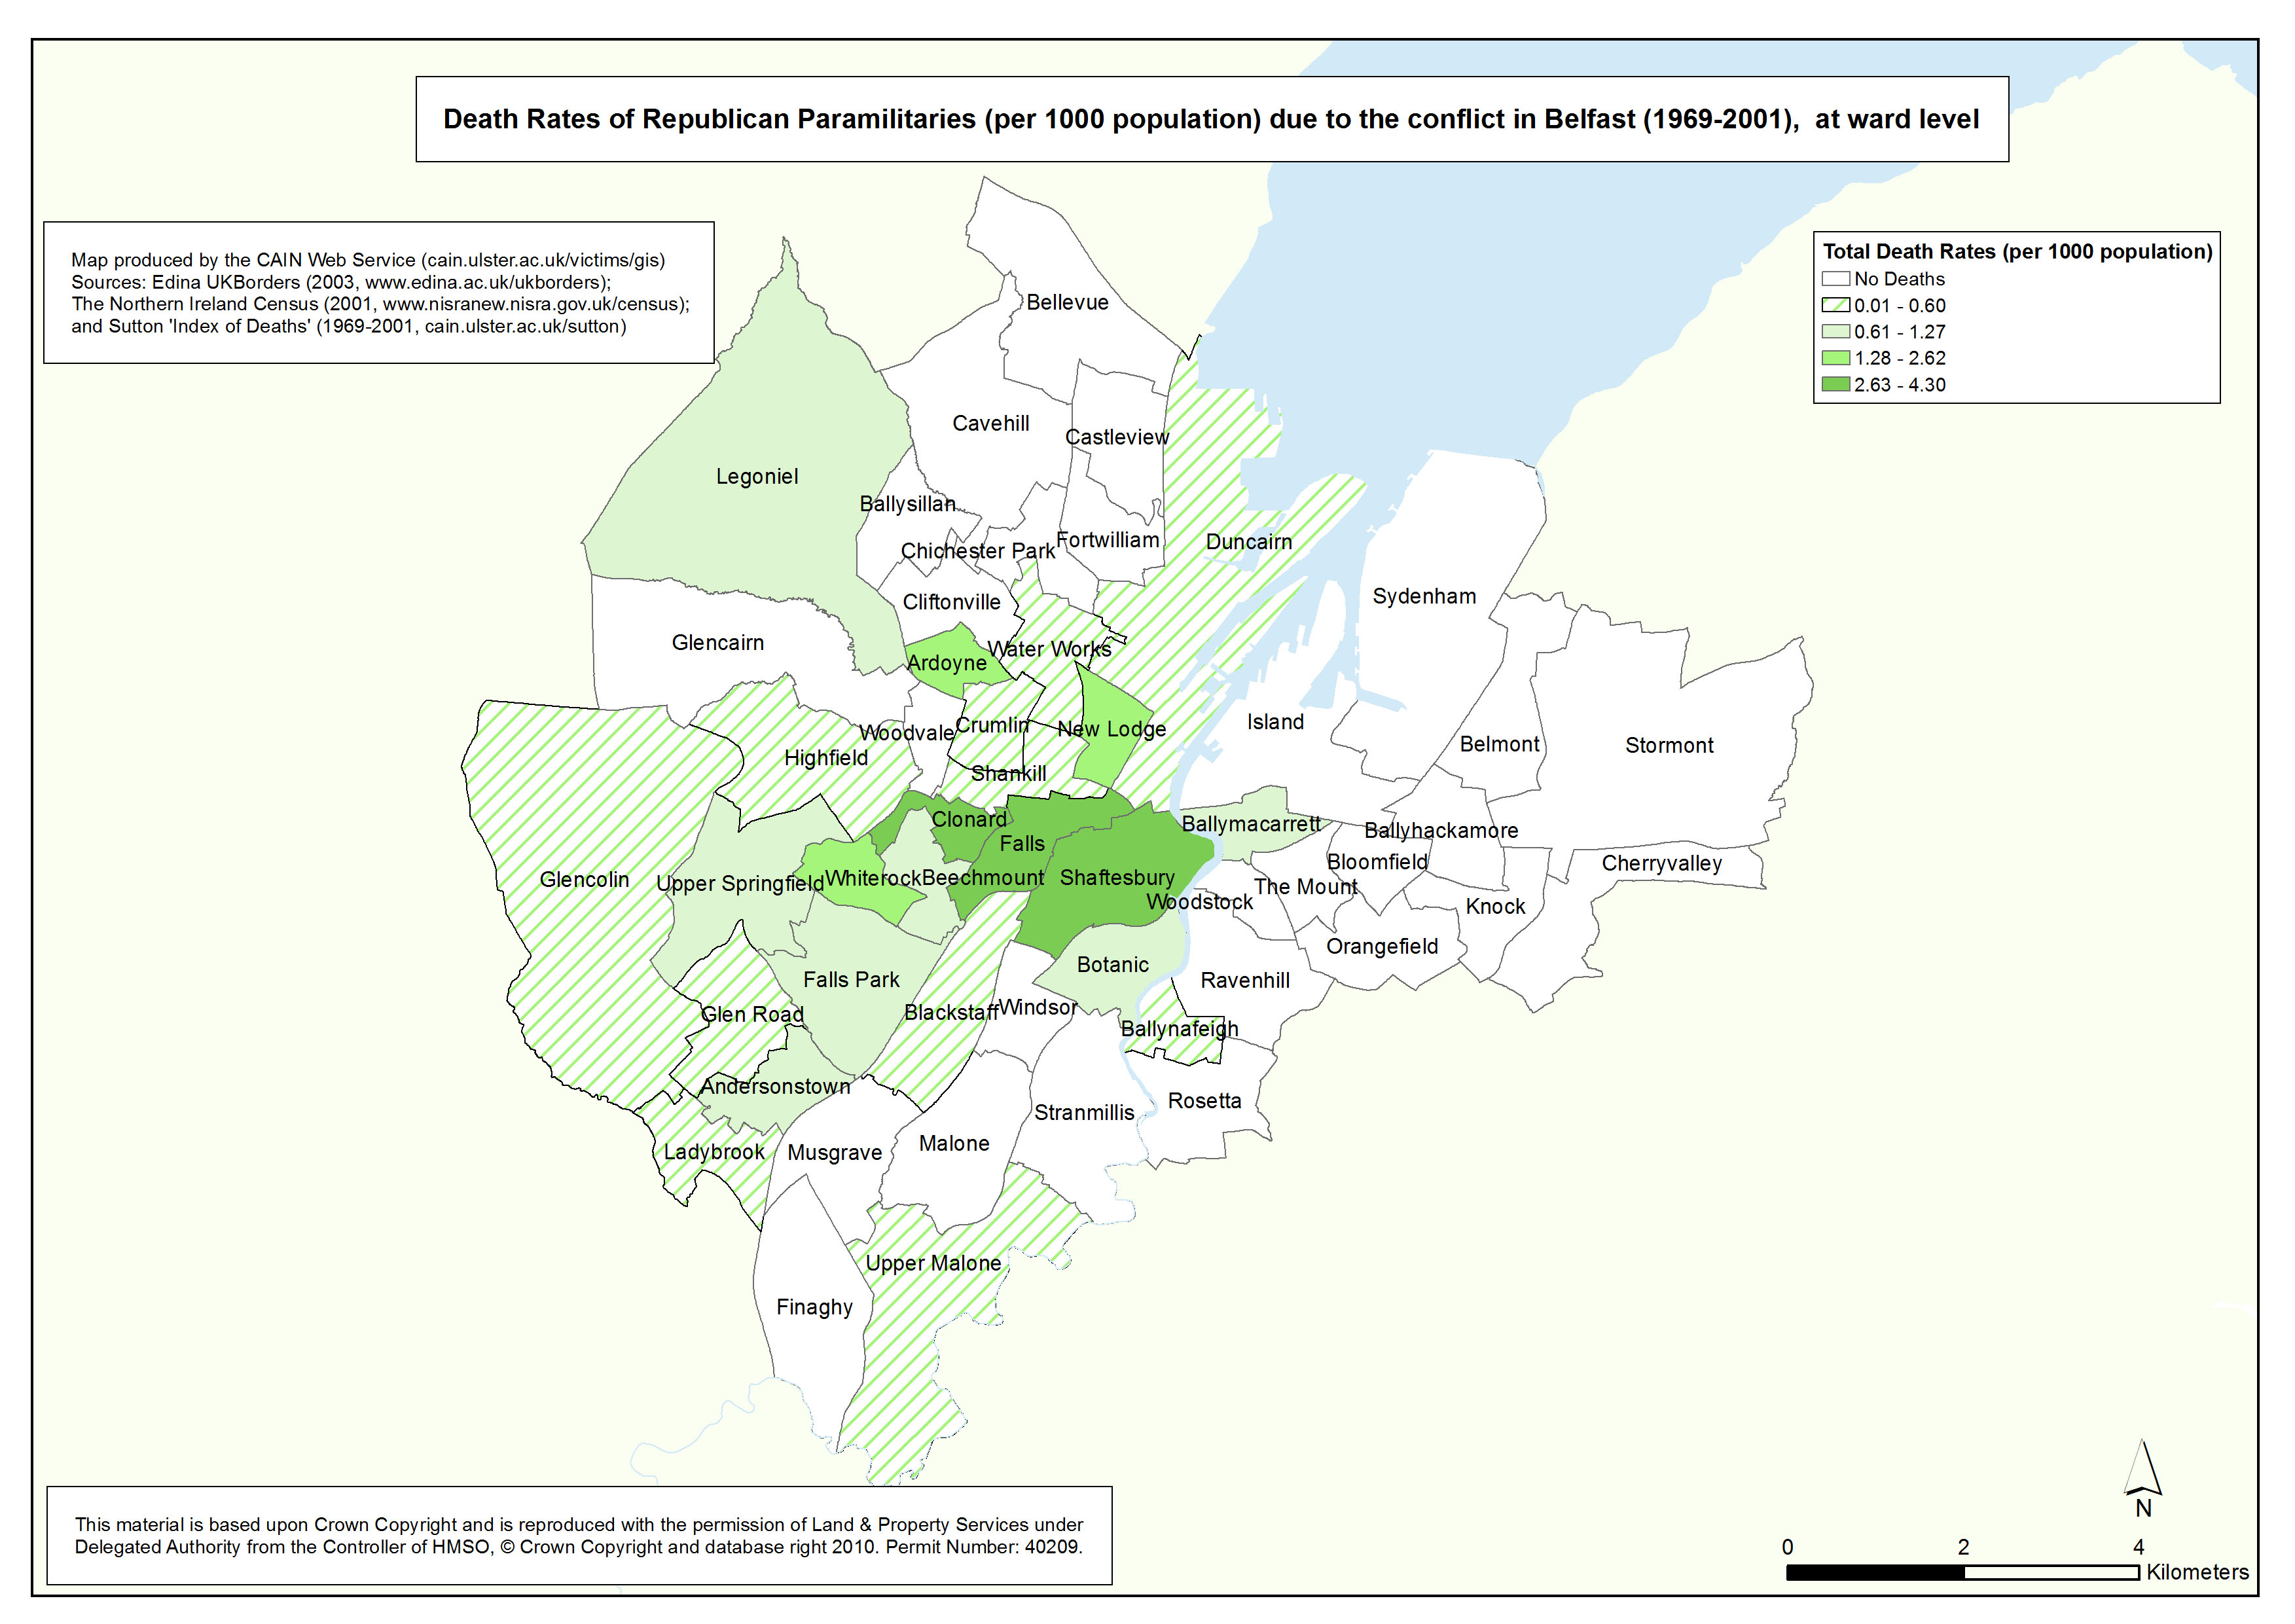
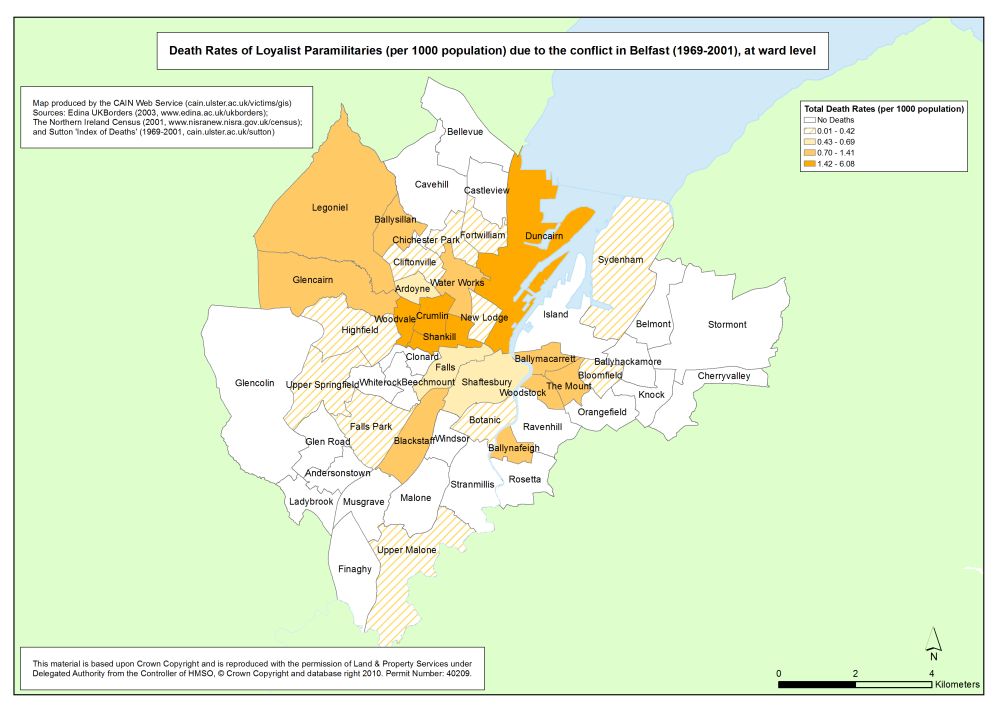
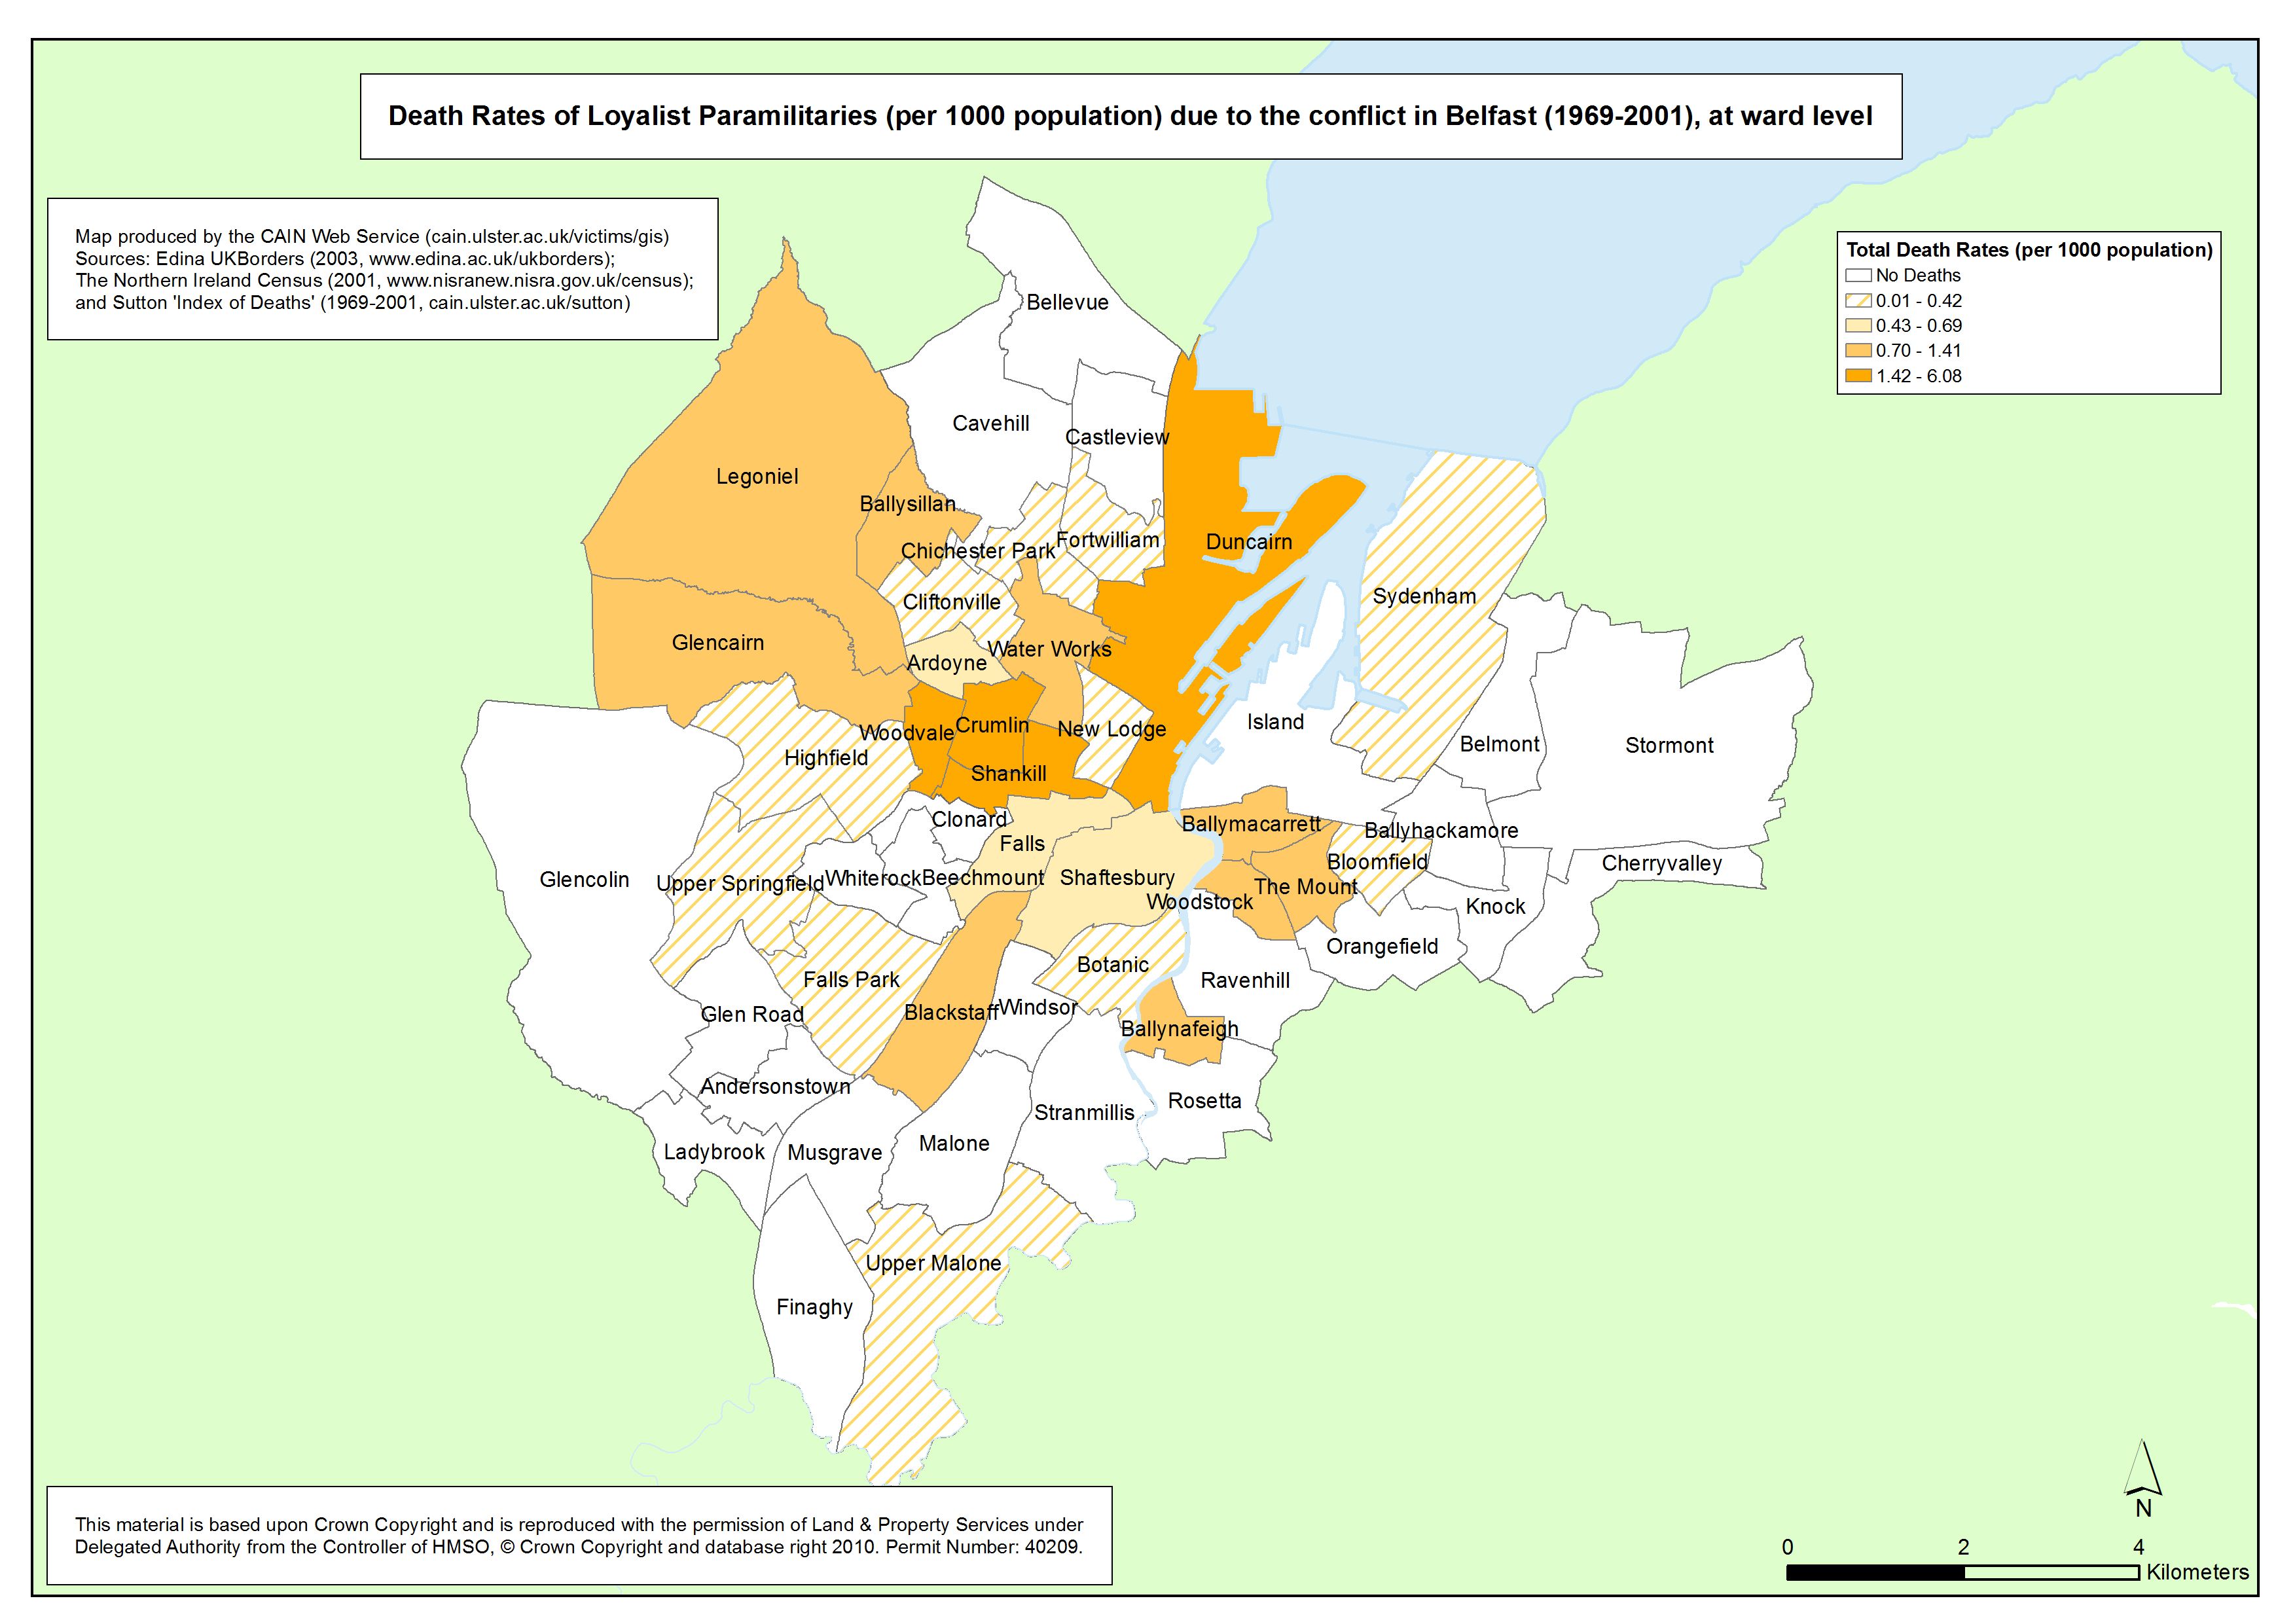
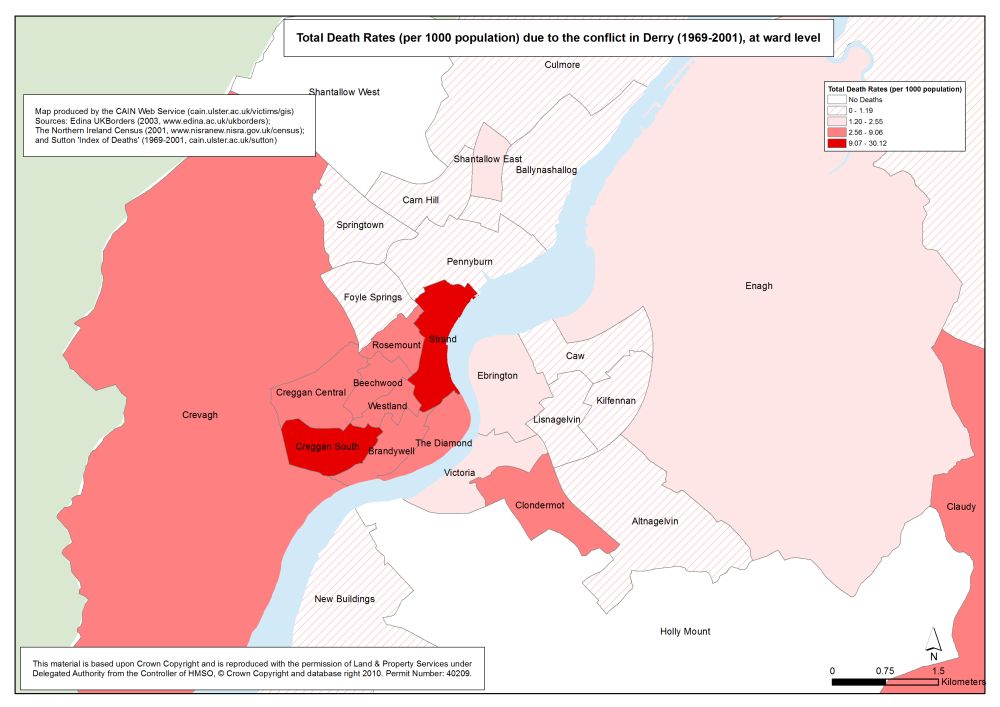
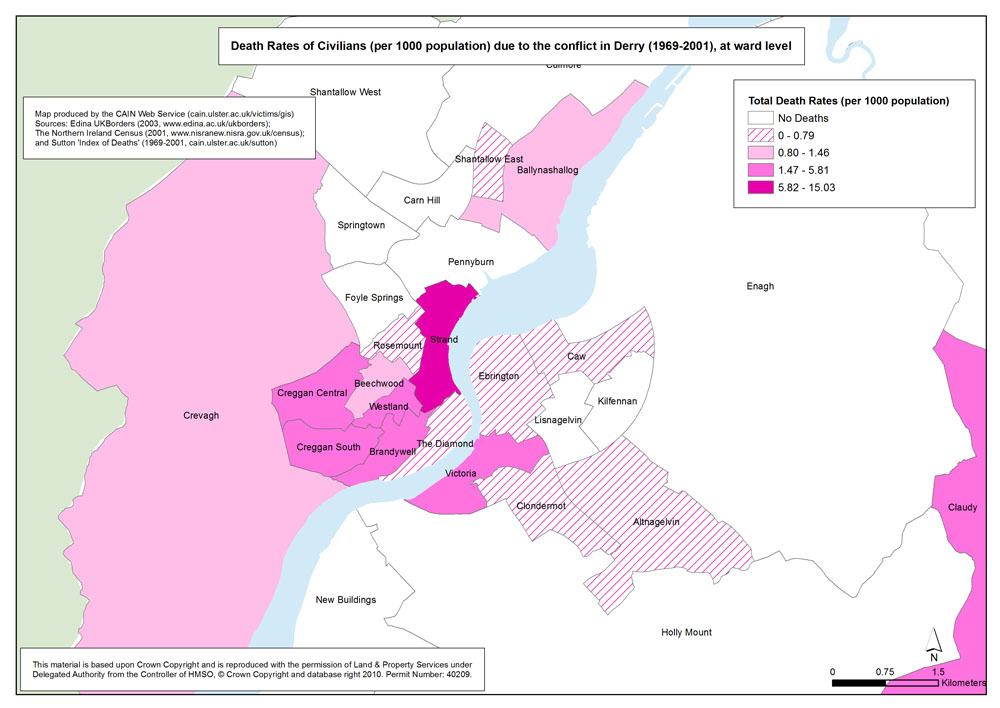
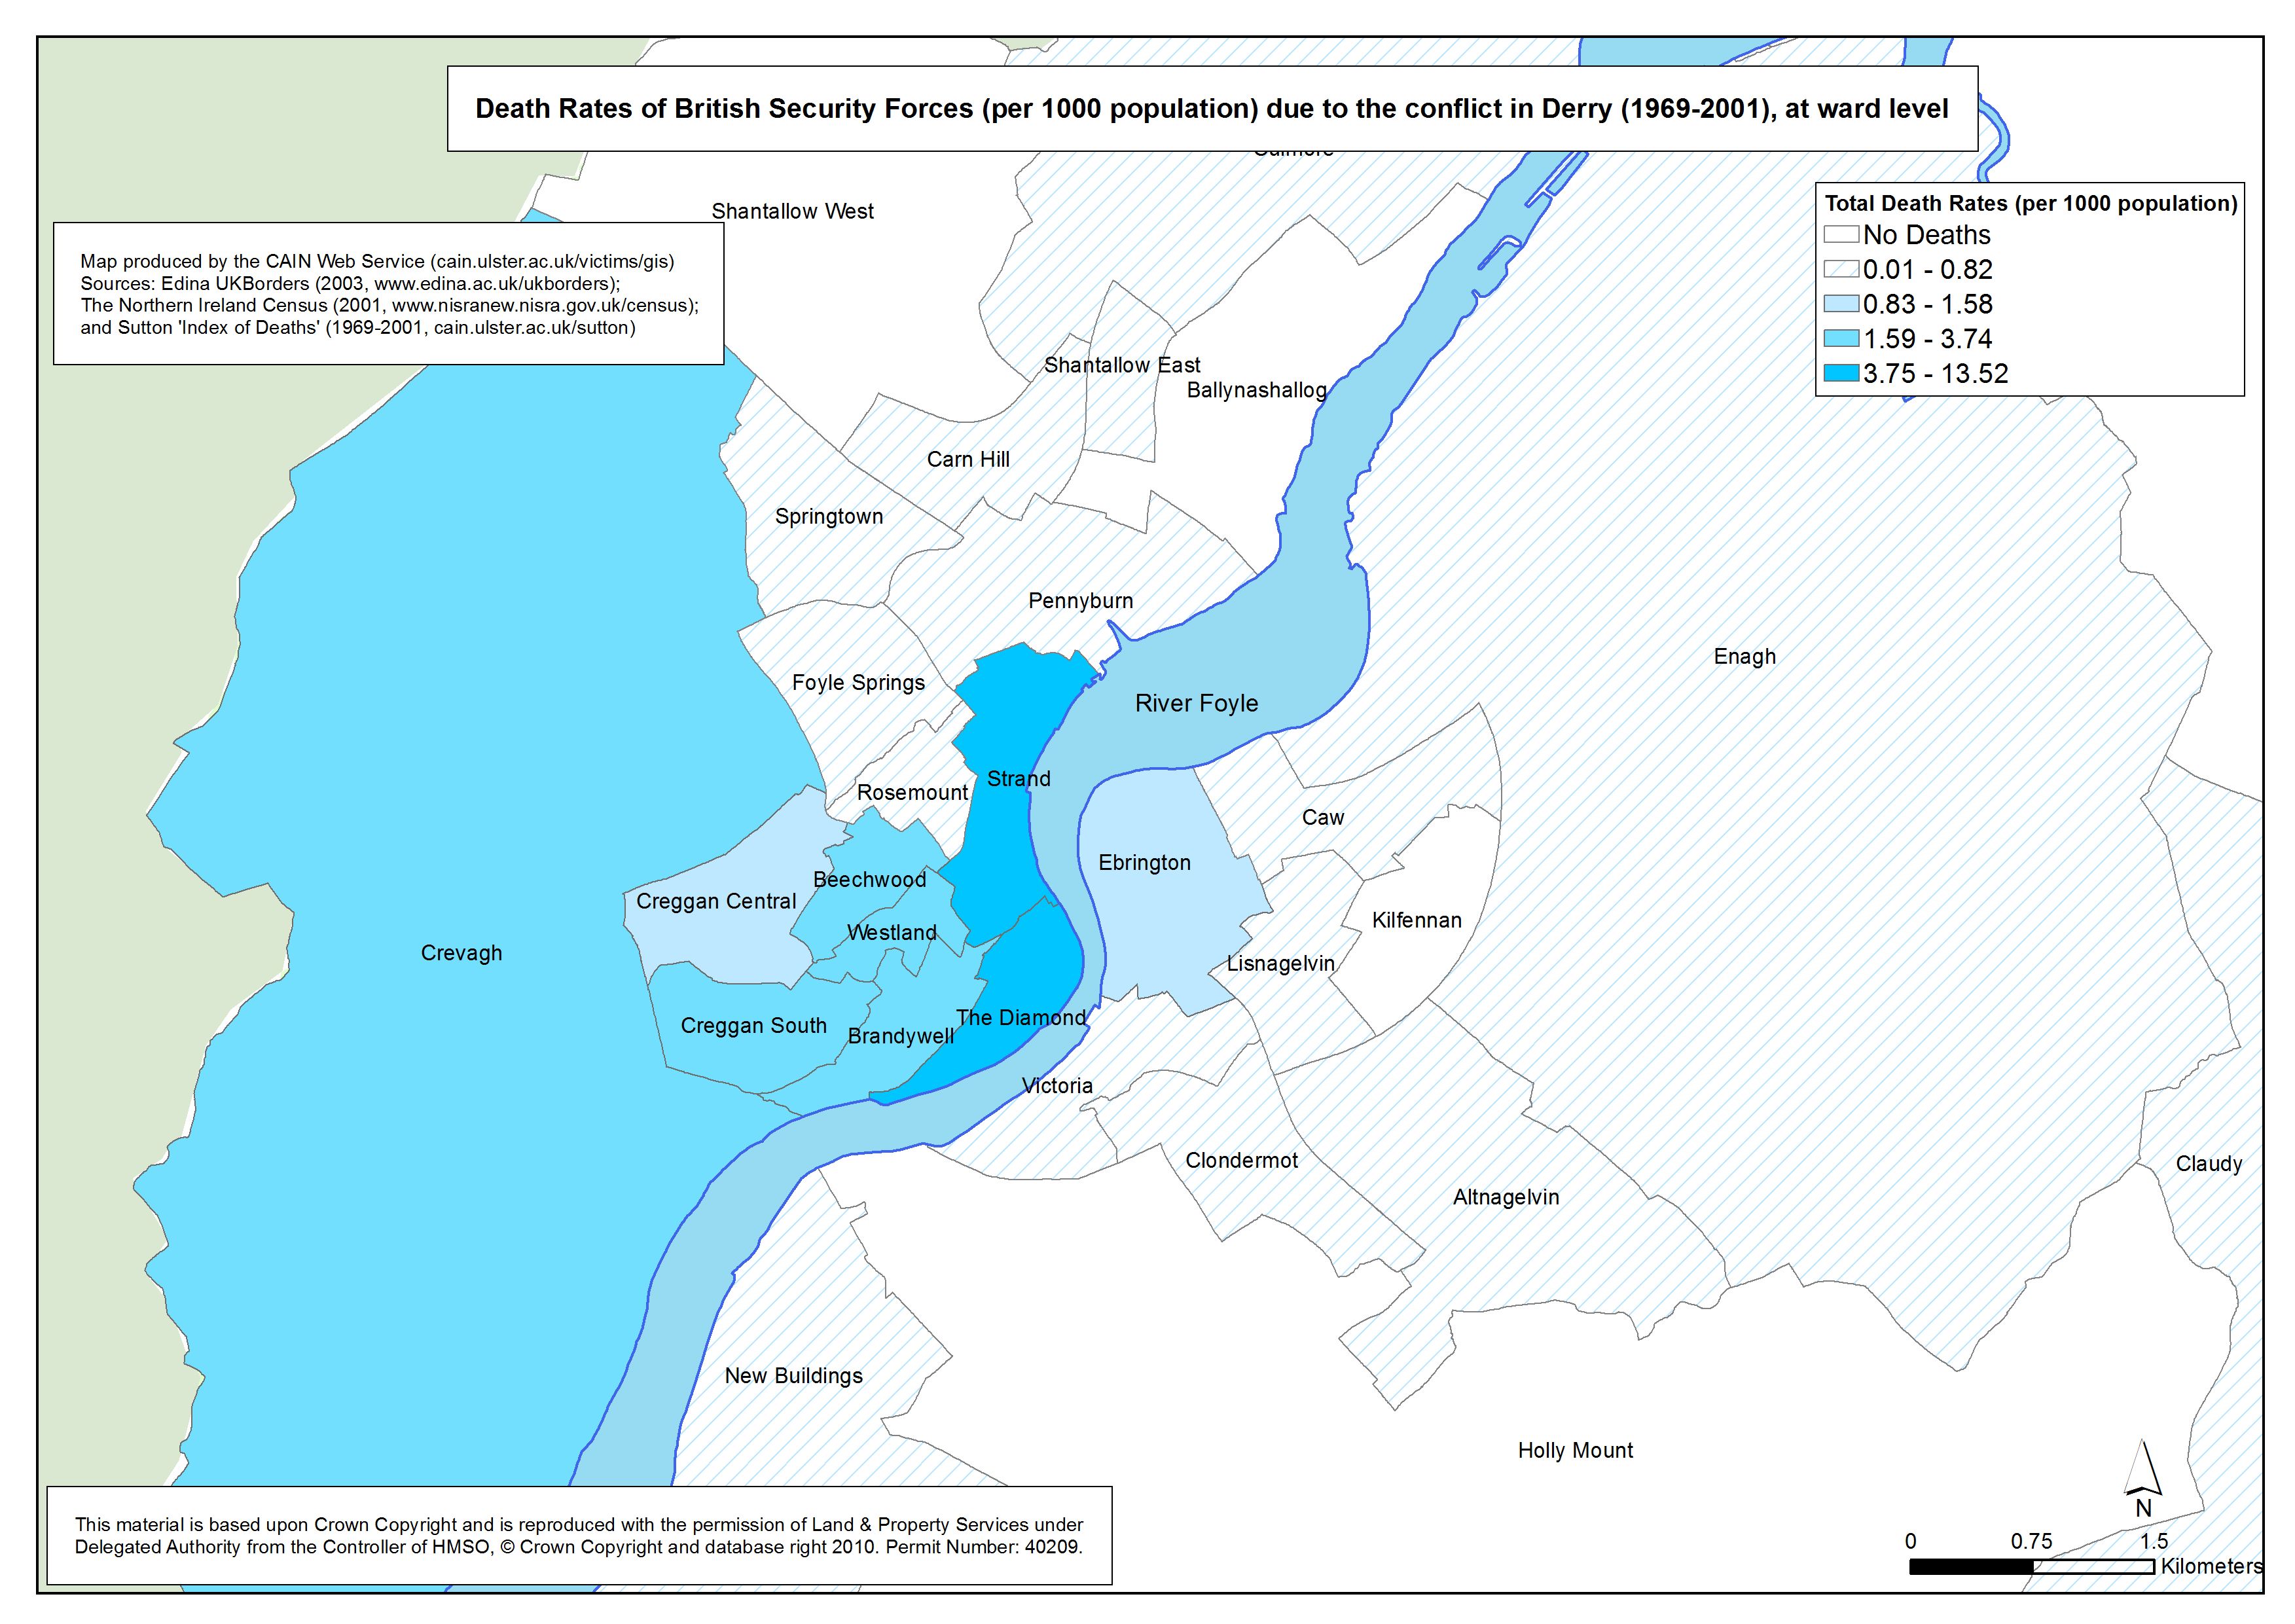
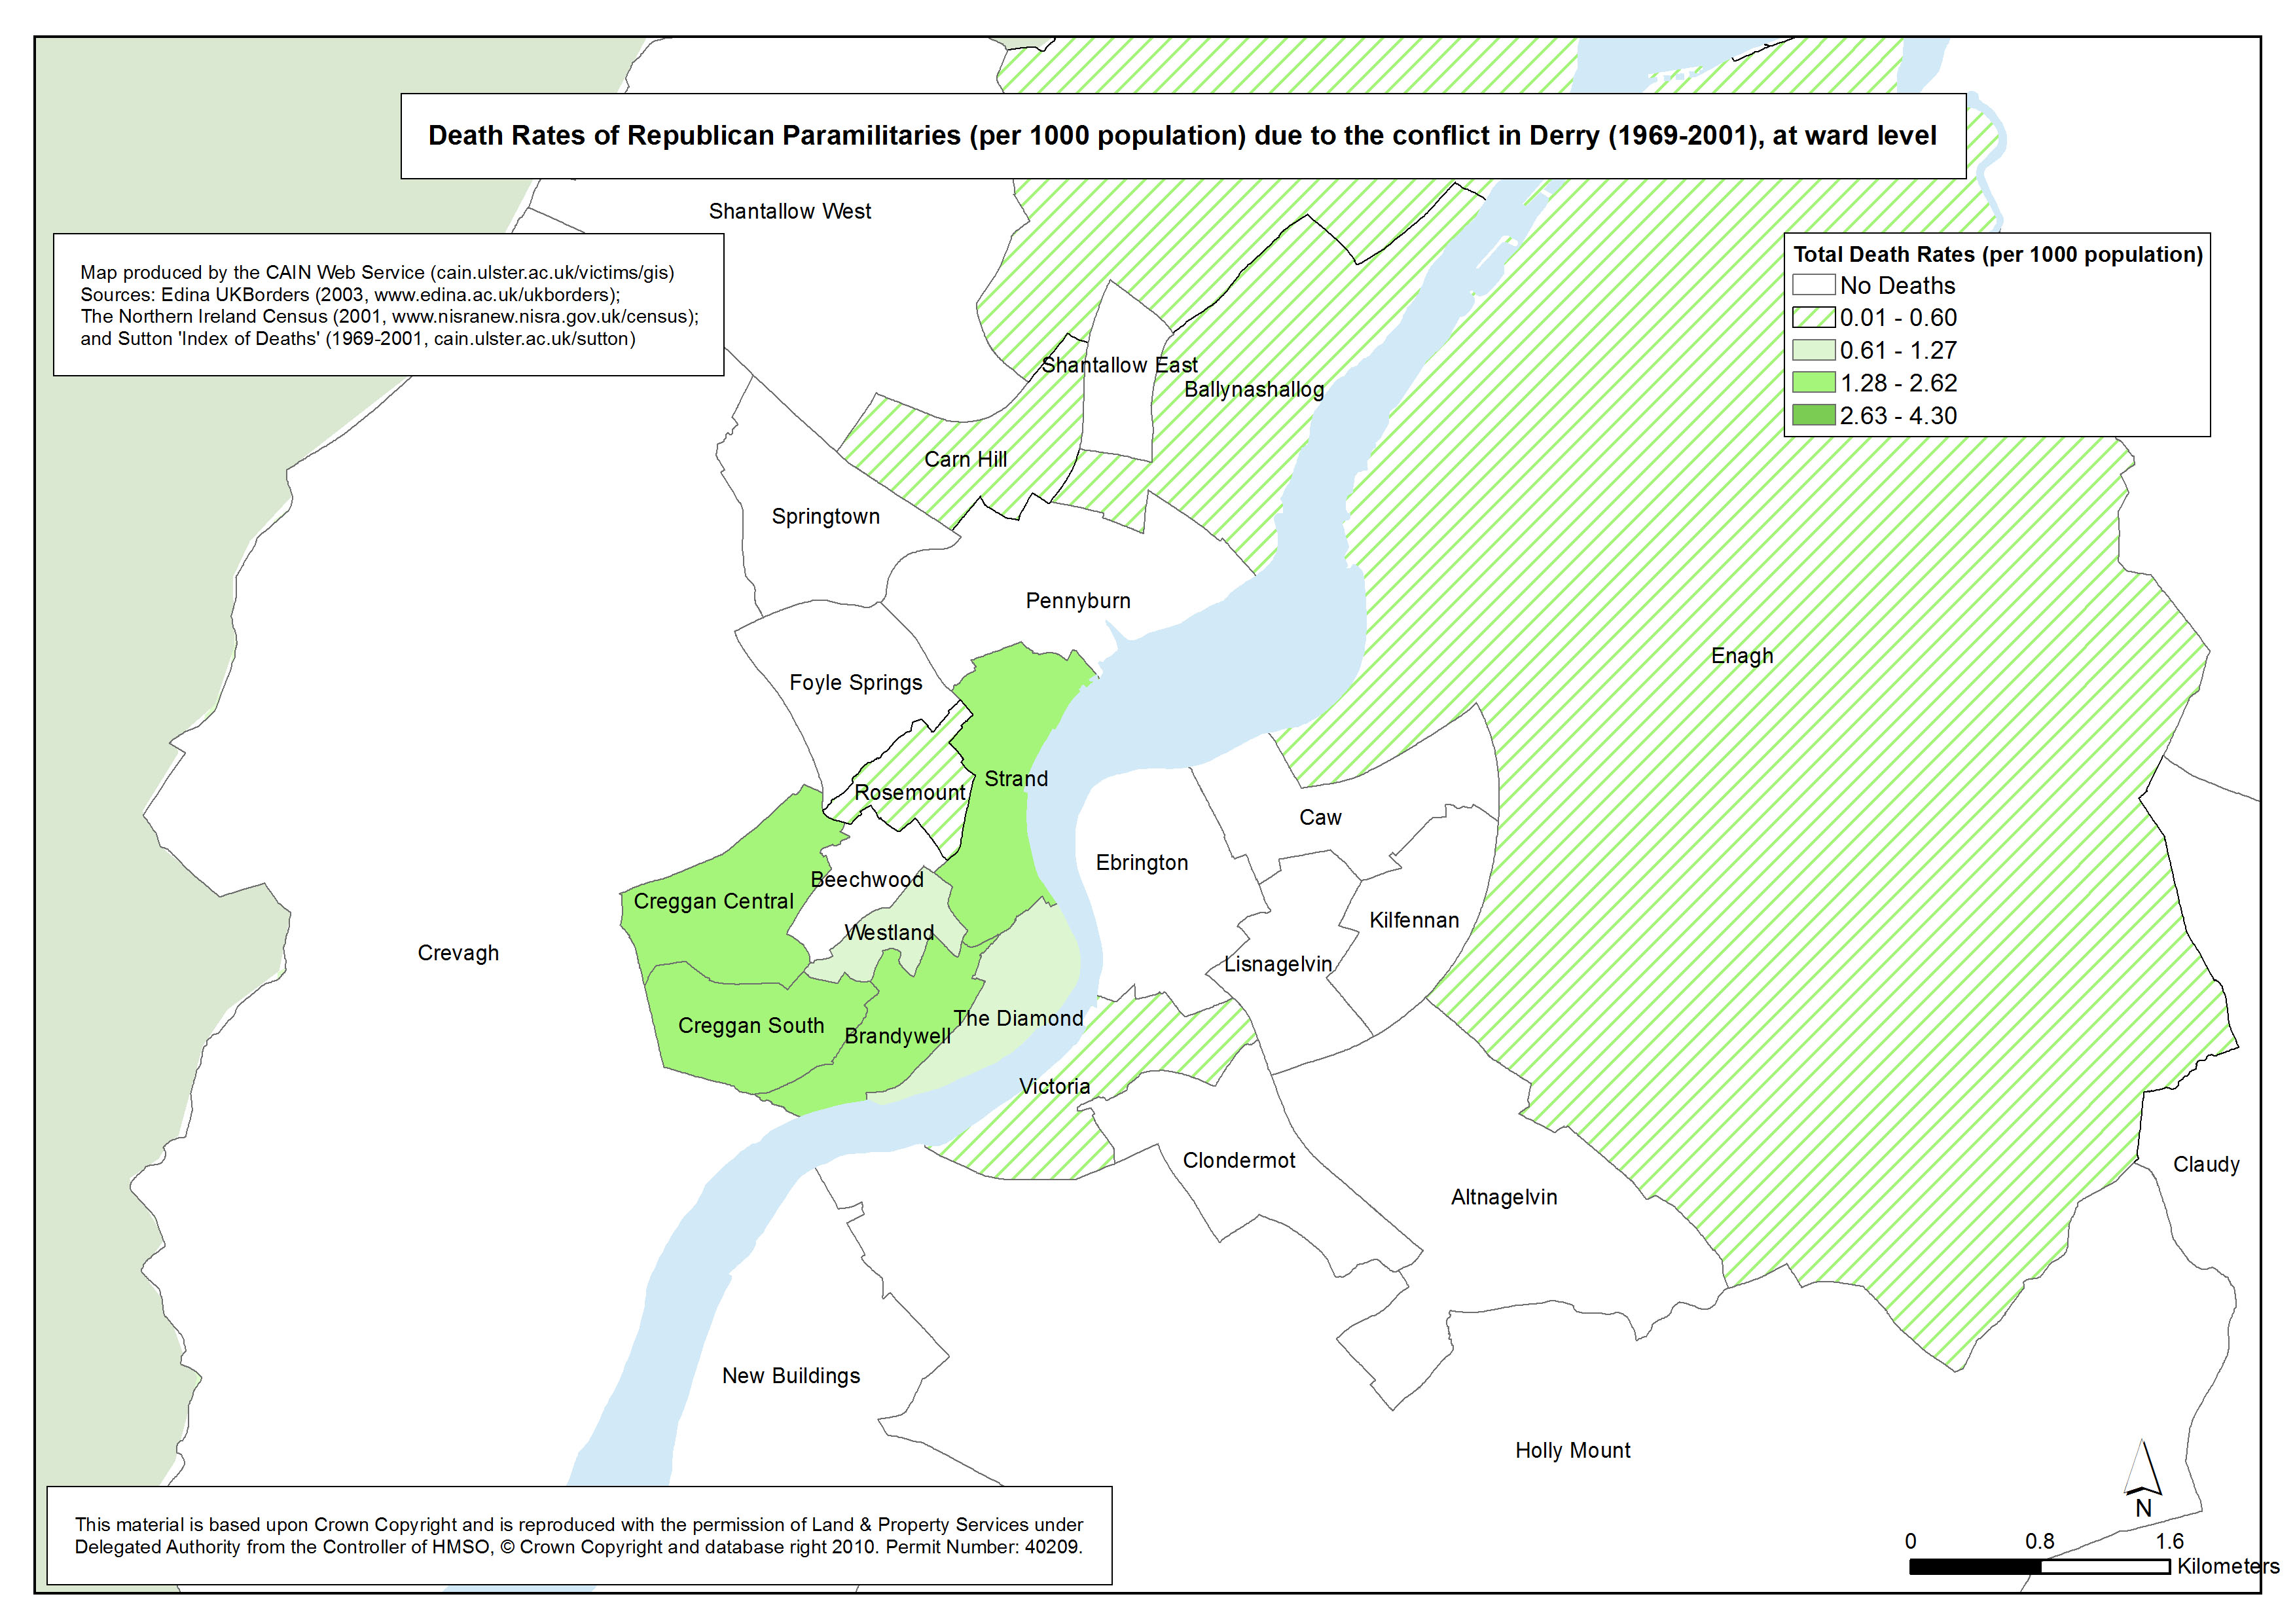
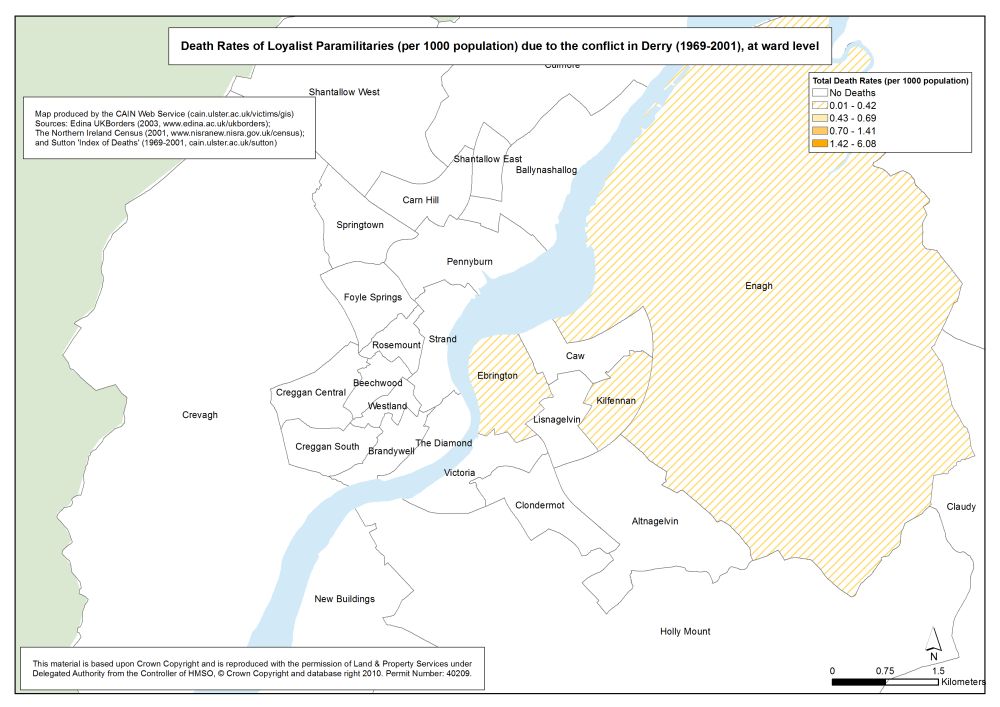
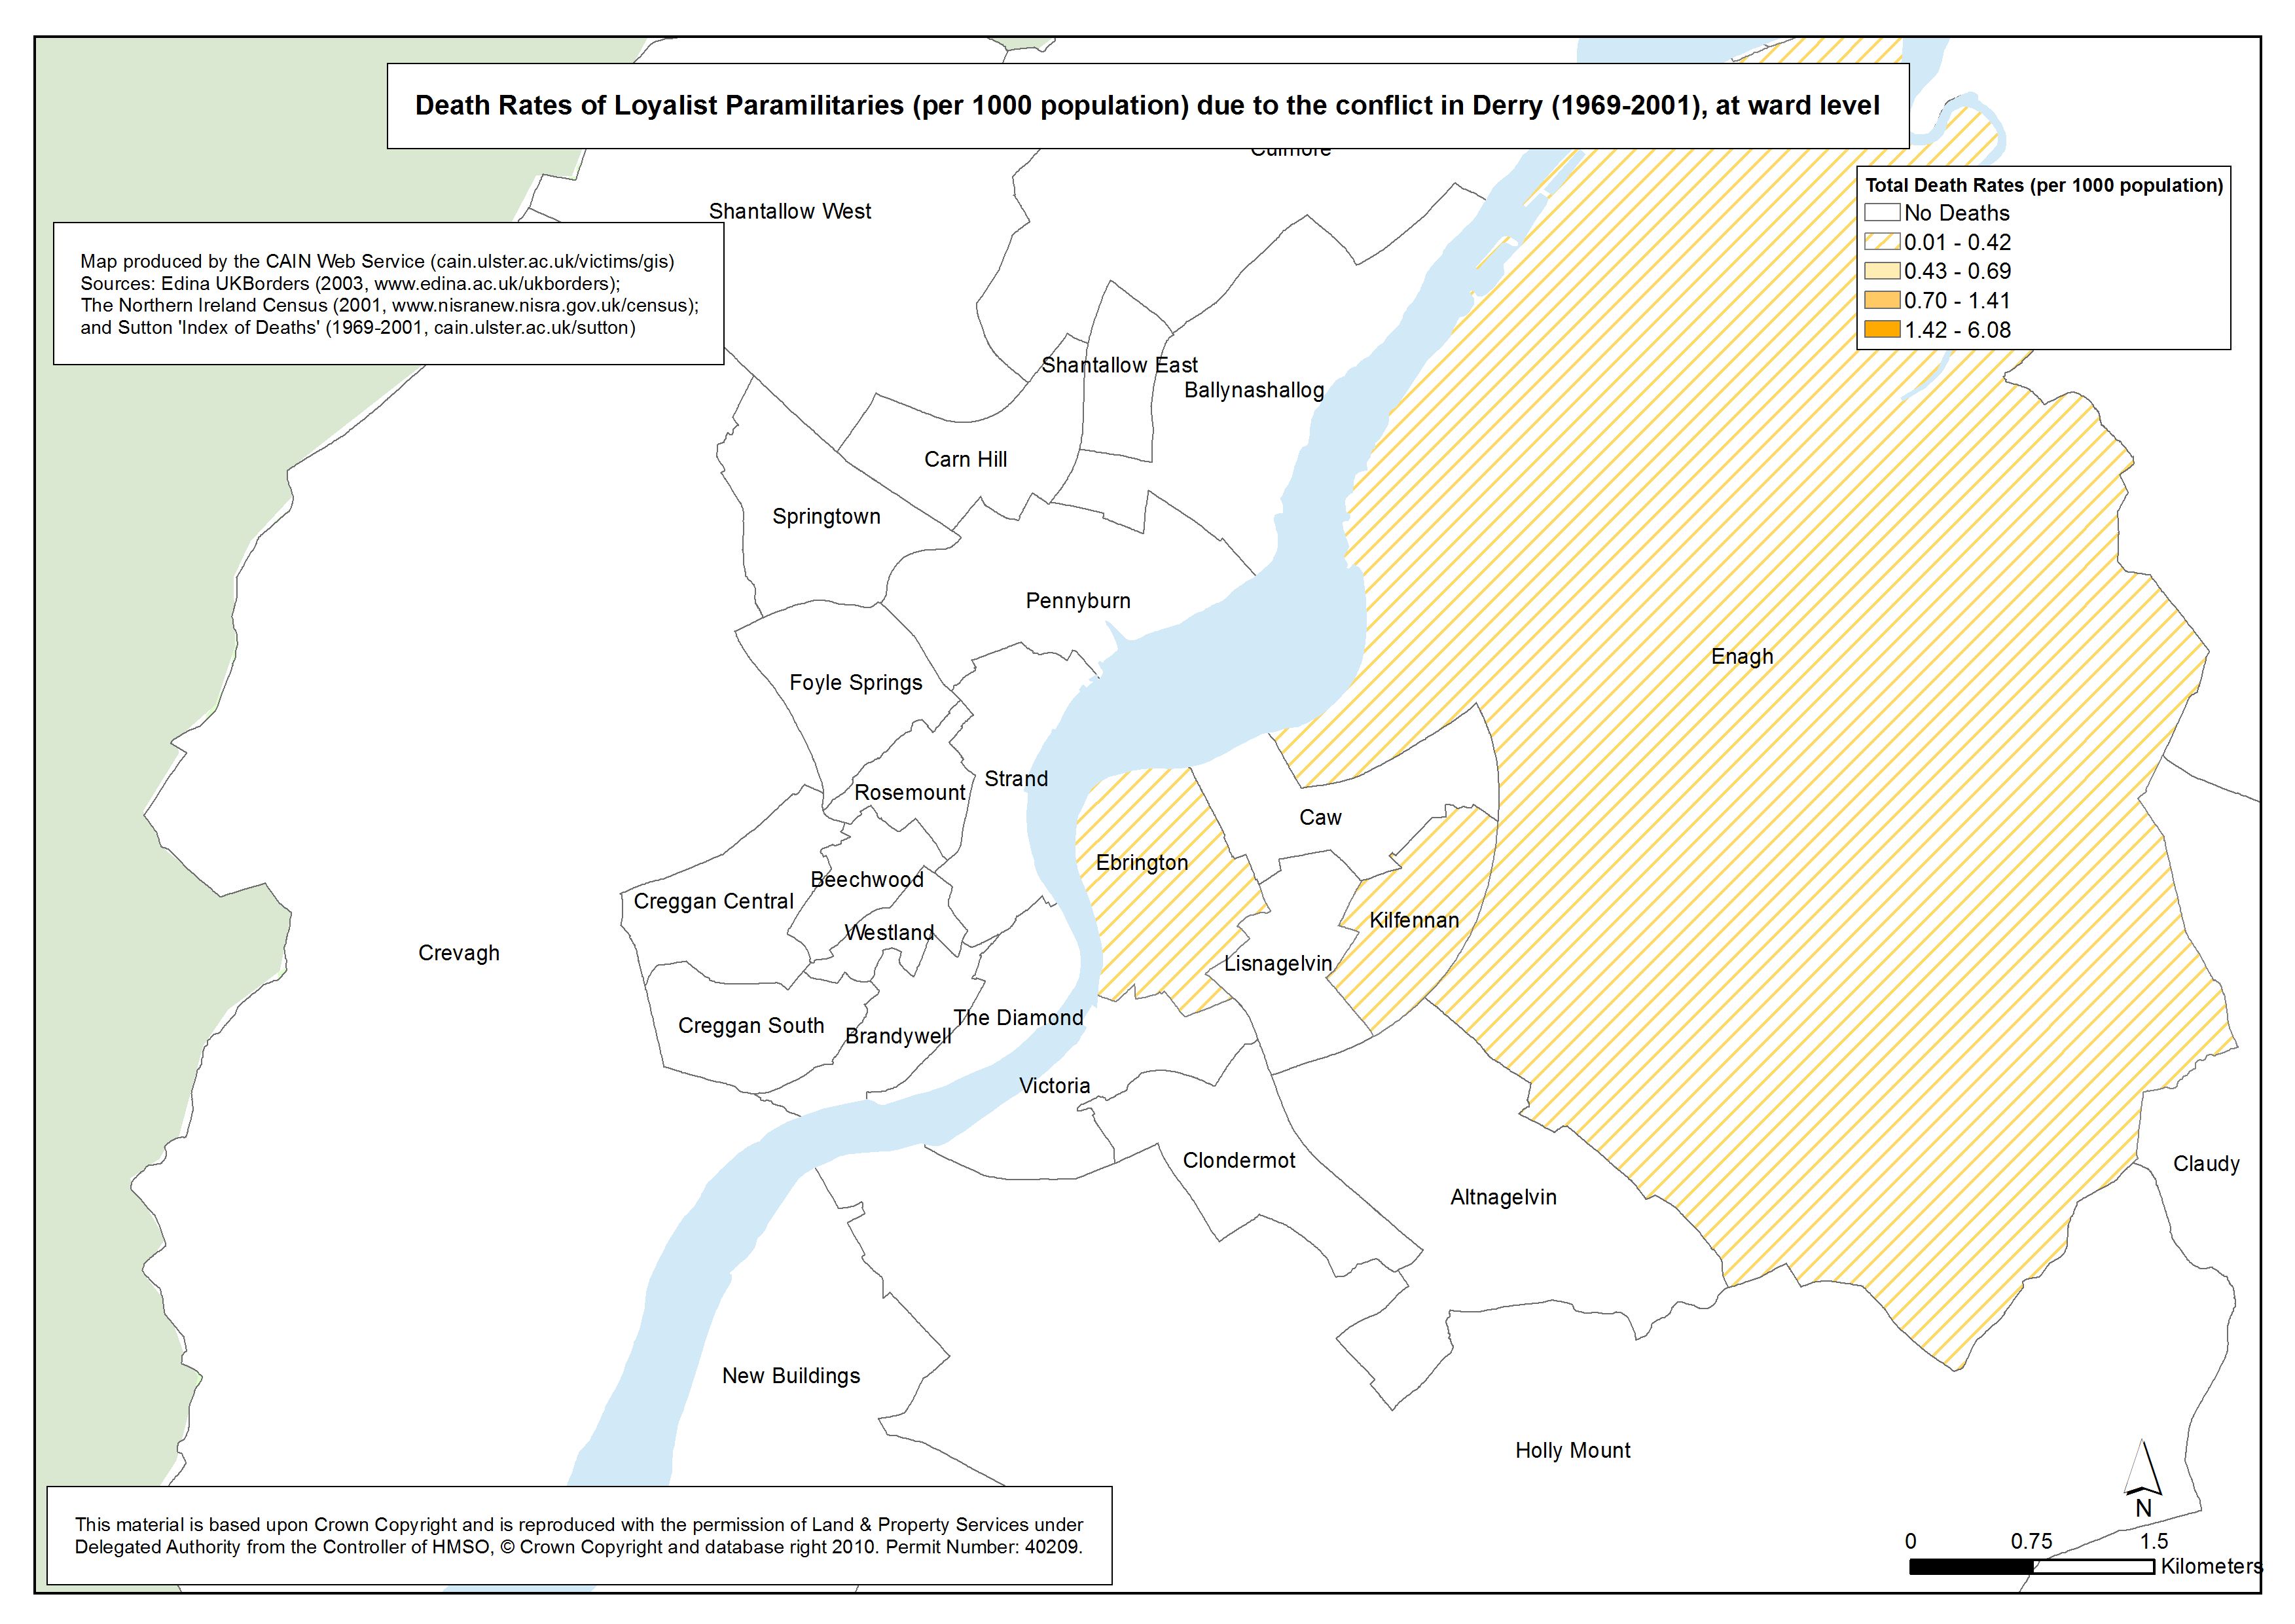
The death rate was calculated by dividing the total number of deaths during the conflict (as recorded in the Sutton Index of Deaths) by the population within the wards which the deaths occurred. The 2001 census population counts for each ward were used. Five categories of status have been mapped: all deaths related to the conflict; Civilian deaths; deaths of British Security personnel; deaths of Republican paramilitaries; and deaths of Loyalist paramilitaries. Three geographical areas have been mapped for each of these five categories: Northern Ireland, Belfast, and Derry. The death rate legend is split into five levels for each of the categories mapped. The first level is Nil deaths; the second level is the number of wards which fall in the lowest 50 per cent of death rates; the third level is the number of wards in the next highest 22.5 per cent of death rates; the fourth level is the number of wards in the next 22.5 per cent of death rates; and the fifth level are the wards within the top 5 per cent of death rates.
Other researchers have mapped the deaths that occurred as a result of the conflict. However, it is often the case that the maps that appear in academic journal articles and books are not at a scale which allows the detailed information to be easily viewed. It was decided that for the Visualising the Conflict project it would be important to produce a range of maps, at sufficient scales, to allow users to examine the information in detail. It is also the case that other researchers have mapped datasets of deaths that were not based on Malcolm Sutton's Index of Deaths. Due to criteria used by different compilers, no two list of deaths are the same. CAIN has worked with Malcolm Sutton since 1999 to amend his list in response to feedback in the form of hundreds of emails and letters. As a result the accuracy of this information has improved over the years. For those unfamiliar with the Northern Ireland conflict the first thing they may notice in the maps displaying total death rates for Northern Ireland and Belfast, is the uneven spread of the conflict. There are wards in the region within which no deaths occurred as a result of the conflict. There are other wards which suffered quite high rates of deaths. The overall pattern was for high levels of deaths to occur in Belfast, particularly north and west Belfast, Derry, south Armagh, east Tyrone and the border counties.
The electoral ward shapefile was downloaded from EDINA borders Web site: The number of deaths is based on the Malcolm Sutton Index of Deaths (1969-2001): The 2001 census population counts for each ward were downloaded from Northern Ireland Statistics and Research Agency (NISRA) Web site:
The GIS maps listed above have been produced as part of the AHRC 'Visualising the Conflict' Project. The maps have been reproduced and made available with the permission of Land & Property Services under Delegated Authority from the Controller of HMSO, © Crown Copyright and database right 2010; Permit Number: 40209. All maps were prepared by Luke Kelleher, then a Research Associate (GIS) working with CAIN. All maps were sized A4 (approximately). GIS software was used to produce TIFF versions (A4 approx; 300dpi) which are available on request. Three versions of each map have been made available above:
Users of the above maps should note that the choice of the number of levels at which to draw the map information, together with the cut-off points used for these levels, depends on decisions made by the researchers involved. While it is true that it would be possible to produce a different set of maps using different cut-off points, the researchers feel that the ones chosen provide the greatest level of clarity, with the greatest level of detail, and reflect the underlying patterns in the data. It is also worth stating that using the population in 2001 as the basis for calculating the death rates is a compromise solution. To be entirely accurate it would be necessary to work out how many people lived in a particular area during the time being considered (1969-2001). The additional time taken to work out these figures would not be rewarded by any significant increase in accuracy. Hence the researchers, as is the case with other researchers, have chosen the population in a particular year to represent the relative population level over the time period. Return to List of Map Sets
|
|||||||||||||||||||||||||||||||||||||||||||||||||||||||||||||||||||||||||||||||||||||
|
Last modified:
January 18, 2012 22:52
|
||
|
|
||
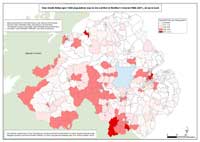 This set of 15 maps illustrates the death rates per 1000 population, for five categories of status, due to the conflict in Northern Ireland between 1969 and 2001. The data is mapped at electoral ward level. There are 582 electoral wards in Northern Ireland as defined by the Boundary Commission for Northern Ireland in 1995.
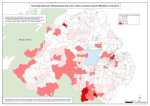 Deaths - NI - Ward
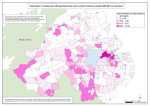 Deaths - NI - Civilians - Ward
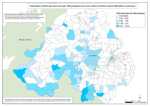 Deaths - NI - British Security Forces - Ward
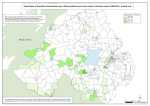 Deaths - NI - Republicans - Ward
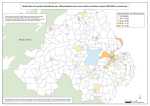 Deaths - NI - Loyalists - Ward
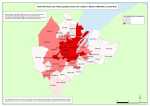 Deaths - Belfast - Ward
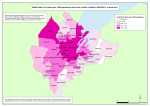 Deaths - Belfast - Civilians - Ward
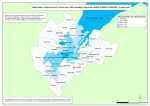 Deaths - Belfast - British Security Forces - Ward
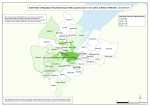 Deaths - Belfast - Republicans - Ward
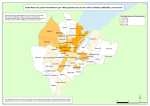 Deaths - Belfast - Loyalists - Ward
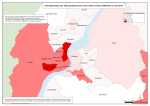 Deaths - Derry - Ward
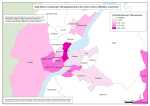 Deaths - Derry - Civilians - Ward
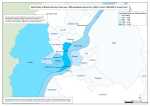 Deaths - Derry - British Security Forces - Ward
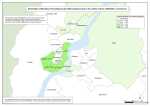 Deaths - Derry - Republicans - Ward
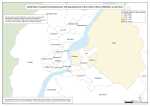 Deaths - Derry - Loyalists - Ward
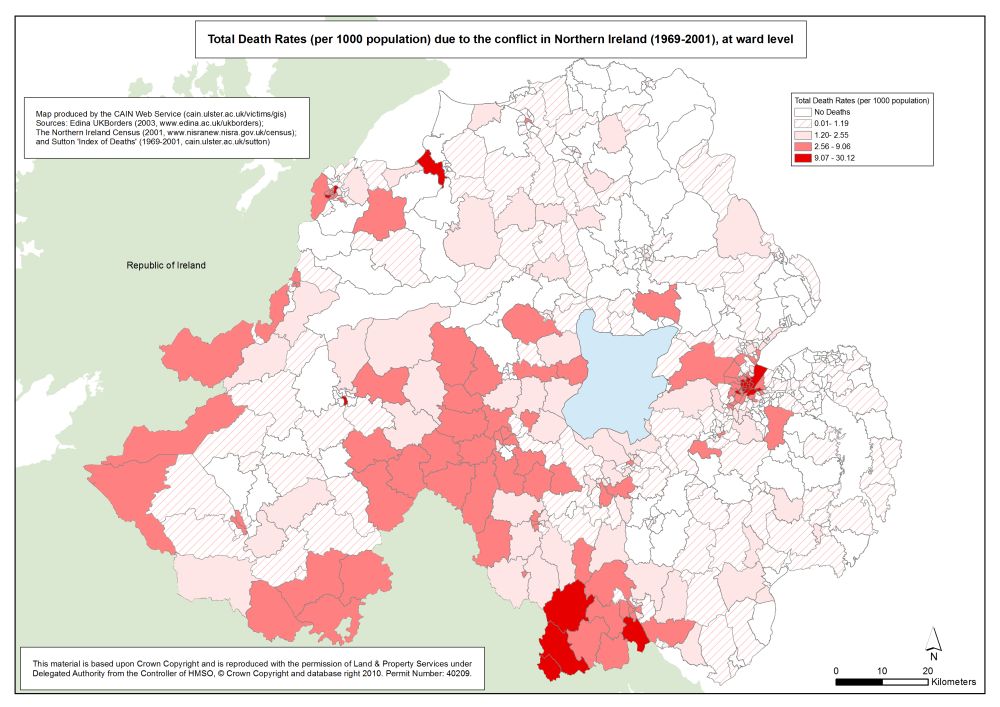