
'Violence in Northern Ireland, 1969 - June 1989'
| ||||||||||||||||||||||||||||||||||||||||||||||||||||||||||||||||||||||||||||||||||||||||||||||||||||||||||||||||||||||||||||||||||||||||||||||||||||||||||||||||||||||||||||||||||||||||||||||||||||||||||||||||||||||||||||||||||||||||||||||||||||||||||||||||||||||||||||||||||||||||||||||||||||||||||||||||||||||||||||||||||||||||||||||||||||||||||||||||||||||||||||||||||||||||||||||||||||||||||||||||||||||||||||||||||||||||||||||||||||||||||||||||||||||||||||||||||||||||||||||||||||||||||||||||||||||||||||||||||||||||||||||||||||||||||||||||||||||||||||||||||||||||||||||||||||||||||||||||||||||||||||||||||||||||||||||||||||||||||||||||||||||||||||||||||||||||||||||||||||||||||||||||||||||||||||||||||||||||||||||||||||||||||||||||||||||||||||||||||||||||||||||||||||||||||||||||||||||||||||||||||||||||||||||||||||||||||||||||||||||||||||||||||||||||
| . | . | . | ||||
| Year | ||||||
| 1969 | ||||||
| 1970 | ||||||
| 1971 | ||||||
| 1972 | ||||||
| 1973 | ||||||
| 1974 | ||||||
| 1975 | ||||||
| 1976 | ||||||
| 1977 | ||||||
| 1978 | ||||||
| 1979 | ||||||
| 1980 | ||||||
| 1981 | ||||||
| 1982 | ||||||
| 1983 | ||||||
| 1984 | ||||||
| 1985 | ||||||
| 1986 | ||||||
| 1987 | ||||||
| 1988 | ||||||
| TOTAL | ||||||
Source: RUC official data.

Source: Drawn from Table A3.1

Source: Drawn from Table A3.1
The death-toll after the Anglo-lrish Agreement (AIA) was signed (November 1985) confirms the overall downward trend since the early and mid-1970s if one takes a long-term view. An average of 82 deaths in the years 1986-8 compares with an average of 85 deaths per annum since 1977. However, there is a perceptible upward trend in the death-toll after the AIA if one takes a short-term view and compares the death-toll in the three years 1986-8 (61, 93, 93) with the toll in 1983-5 (77, 64, 54) - although we shall discuss below whether this upward trend was caused by the AIA. One way to put the apparent impact of the AIA in long-term perspective is by inspecting Figure A3.2, the cumulative annual death-toll. The post-AIA death-toll seems to have restored the post-1976 trend after the brief fall in the years 1983-5.
There are three basic explanations for the fall-off in deaths since the early and mid-1970s. First, loyalist paramilitaries have ceased to engage in sectarian killings of Catholics on the same scale as they did in the years 1971-6. Many of them have been arrested and jailed, and their organizations have become more factionalized, corrupt, and directionless. Second, nationalist paramilitaries have also changed their strategies and organizations in ways which have reduced the annual death-toll. Many of them have also been arrested and jailed; and their organizations have become smaller and structured in cells or 'active service units' (Bishop and Mallie 1987). The 'cell structure' was partly adopted in response to declining popularity in nationalist areas but also for strategic reasons - to avoid penetration by the security forces. The Provisional IRA have aimed primarily to attack 'military targets' (i.e. members of the security forces) since the mid-1970s, and have consequently reduced their use of bombs in urban areas- a tactic which killed many civilians, both Catholic and Protestant, in the early 1970s. Finally, more effective surveillance and knowledge on the part of the security forces may have dampened the potential levels of violence. However, this final explanation has to be qualified in the light of firm evidence that the actions of the security forces have frequently, if sometimes unintentionally, raised the levels of violence.
Time-series trends in deaths are available in a crude form from
RUC data. Figure A3.3 confirms the downward trend in civilian
deaths since the 1971-6 period - although RUC data do not enable
us to follow victims by religions category over time. It also
shows a dramatic falling off in the number of deaths sustained
by the British Army (excluding the Ulster Defence Regiment). Finally,
since the early 1980s the local security forces (the RUC/RUC Reserve
and the UDR) have suffered an increasing proportion of the deaths
sustained by the security forces. In part this trend reflects
'Ulsterization'-the Northern Ireland Office's policy preference
for local as opposed to British forces-but it also suggests a
switch in the targets chosen by nationalist paramilitaries. 'Ulsterization'
and the rising death-toll of local security forces are naturally
and predictably related.

Source: RUC
The IIP provide a detailed breakdown of the status of victims, as well as categorizing the agents responsible for deaths (see Table A3.2), whereas the RUC merely record whether or not victims were members of the security forces. We can only speculate as to the reasons the RUC fail to provide similarly detailed information. For the present the IIP data base is of much greater use in clarifying the distribution of victims and of responsibility for their deaths.
| . | ||||||
| Category of Victim | unidentified |
|||||
| Security forces | ||||||
| Nationalist paramilitaries | ||||||
| Loyalist paramilitaries | ||||||
| Civilians: | ||||||
| Catholic | ||||||
| Protestant | ||||||
| Religion unknown | ||||||
| Total | ||||||
| TOTAL | ||||||
| As % of all deaths | ||||||
| As % of civilian deaths | ||||||
| Civilian deaths
as % of all deaths |
||||||
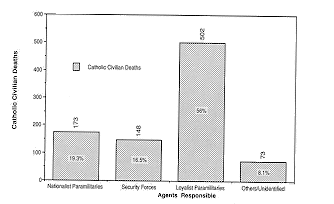
Inspection of Figures A3.4-12, all of which are based on the IIP data base (i.e. Table A3.2, which runs from 1969 to June 1989), illustrates the story. Figure A3.4 presents a pie-chart showing the status of victims over the two decades. Surprisingly, in view of British public perceptions, the largest single category of victims has been Catholic civilians (32.5 per cent), who just shade members of the security forces (31.2 per cent). Given that Protestant civilians outnumber Catholic civilians in the Northern Ireland population by approximately 3 to 2, it is evident that Catholic civilians (896 deaths) have suffered both absolutely and relatively more than Protestant civilians (57-5 deaths). Catholic deaths have been 59.3 per cent of all civilian deaths whereas Protestant deaths represent 38.1 per cent of all civilian deaths. There are four simple explanations for this variance. First, Catholic civilians are the primary targets of loyalist paramilitaries (502), whereas the security forces - including the British Army - are the primary targets of nationalist paramilitaries. Second, the local security forces (the RUC, the RUC Reserves, and the UDR) are recruited primarily from Protestant civilians, and thus the simple comparison of Catholic and Protestant civilian death-rates obscures the number of victims suffered by the Protestant community as a whole. Third, a rather high number of Catholic civilians (173) have been killed by nationalist paramilitaries, whether mistakenly, as 'collateral by-products' of other actions, or deliberately in the 'disciplining' of their own community. However, loyalists have also killed a rather high number of Protestant civilians (110). Finally, Catholic civilians are far more likely to be killed, mistakenly or otherwise, by members of the security forces (148) or by nationalist paramilitaries (173), because armed combat between the latter two groupings is more likely to take place in predominantly Catholic areas.
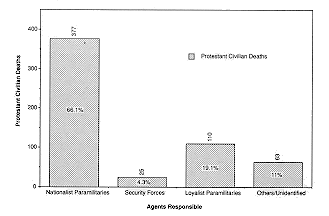
What is also clear from Figure A3.4 is that nationalist paramilitary violence is primarily strategic rather than simply sectarian - especially after 1972-3. More members of the security forces (862) are killed than Protestant civilians (575), and since the former are overwhelmingly killed by nationalist paramilitaries (834, and see Figure A3.8 below), it follows that nationalist paramilitaries partially fulfill their objective of fighting 'a war of national liberation', as opposed to a mere sectarian war. However, Protestants understandably interpret killings of Protestant members of the local security forces as sectarian, and, as we shall see nationalist paramilitaries have also killed a very considerable number of Protestant civilians (377, and see Figure A3.12 below).
Figure A3.4 also shows that nationalist (10.7 per cent) and loyalist paramilitaries (2.5 per cent) combined (13.2 per cent) have suffered fewer deaths than either religious category of civilian. They have also sustained fewer deaths than the security forces. The paramilitaries' low share of the overall death-toll presumably explains why their activities are relatively easily sustained-although it is also clear that nationalist paramilitaries have died more than four times as frequently as loyalist paramilitaries.

Source: Drawn from IIP Agenda Database

Source: Drawn from IIP Agenda Database
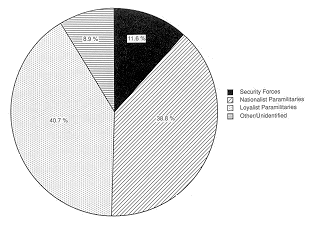
The pie-chart in Figure A3.5 breaks down the agents responsible for all deaths on the basis of IIP data. It shows, contrary to what Irish-American nationalist propagandists imply, that the security forces have been responsible for only 327 deaths or 11.8 per cent of the overall death-toll. Even if they were to be (wrongly) held responsible for all the deaths by other agencies and by unidentified agents, their overall level of responsibility for deaths would still be considerably less than either of the two categories of paramilitaries. What Figure A3.5 shows is that the security forces kill less than half as many people as loyalist paramilitaries and that loyalist paramilitaries kill less than half as many people as nationalist paramilitaries. It confirms that nationalist paramilitaries are responsible for more than half of all deaths (1,593 deaths in total), partially confirming the British perception that they are the primary antagonists in the conflict.
However, a slightly different picture emerges if we remove deaths suffered by the security forces in order to examine the agents responsible for civilian deaths. The pie-chart shown in Figure A3.6 reveals that loyalist paramilitaries have killed slightly more civilians than nationalist paramilitaries (623 compared to 572,), and that both sets of paramilitaries have been responsible for nearly 80 per cent of all civilian deaths. Moreover, a very large share of the deaths due to other or unidentified agents (8.9 per cent) can reasonably be attributed to loyalist and nationalist paramilitaries.
Source: Drawn from IIP Agenda Database
Source: Drawn from IIP Agenda Database
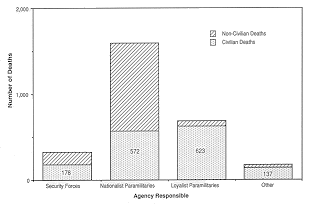
Figure A3.7 shows 'Civilian Deaths as a Proportion of Deaths by Agency'. It is perhaps the most revealing bar-chart. It shows that the security forces kill a civilian 1 time in 2, i.e. they are 'efficient and effective'-if not always law-abiding - only 1 time in 2. This demonstrable evidence of incompetence, error, or malevolence (depending upon one's point of view) is made somewhat more palatable by the low overall share of the death-toll attributable to the security forces. However, the low ratio of 'appropriate' to 'wrongful' killings - especially the disproportionate wrongful killings of Catholics - helps explain why the security forces are poorly regarded by Northern Ireland Catholics.
Nationalist paramilitaries (the IRAs (both Official and Provisional), INLA, and IPLO), as Figure A3.7 also shows, by far exceed all other agents in responsibility for killings. Moreover, they kill non-civilians just over 3 times in 5, a 'kill ratio' which also indicates a high degree of incompetence, error, or malevolence with respect to civilians. Although they are more likely to kill their declared targets than the security forces it is also true that the absolute level of civilian deaths which they have caused (572) is very close to the number of civilians killed by loyalist paramilitaries (623). Although nationalist paramilitary killings are primarily 'non-sectarian' it is obvious that they also kill a very high number of Protestant civilians. Time-series data (in the IIP database) do show, however, that nationalists have killed proportionately higher numbers of non-civilians in the last decade.
The final striking feature of Figure A3.7 is that loyalist paramilitaries kill civilians almost exclusively. This feature of their activities has been consistent since their first eruption (Boulton 1973; Dillon and I,ehane 1973). It is also easy to explain. Catholic civilians are easier to identify than nationalist paramilitaries. They are also softer targets. They are therefore killed in acts of 'representative violence' (Wright 1987) which are meant to deter Catholics from supporting the IRA or other nationalist organizations. Thus although loyalist killing appears more random and less instrumental than nationalist killing it too is generally 'rational', i.e. goal-governed behaviour based upon attention to the consequences of action. This point is reinforced by considerable event-data evidence which shows that loyalists have engaged in systematically 'retributive' rather than purely random killing. However, there have also been a high number of psychopathic killings by supposedly politically motivated loyalists. (The same psychopathic propensity is also true-although to a lesser extent-of nationalist paramilitants.) The most barbaric of these activities were carried out by the 'Shankill butchers' (Dillon 1989).
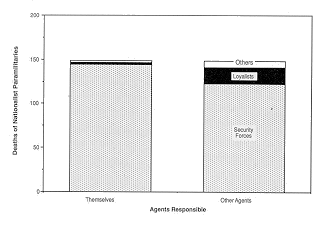
The next set of Figures (A3.8-12) displays the agents responsible for the deaths of the five main groupings to have sustained high death-tolls (nationalist paramilitaries, members of the security forces, Catholic civilians, Protestant civilians, and loyalist paramilitaries). Figure A3.8 demonstrates a very striking feature of the deaths of nationalist paramilitaries. Nationalist paramilitaries themselves kill almost as many nationalist paramilitaries (146) as all other agencies combined (149). There are three explanations for this surprising fact. First, nationalist paramilitary organizations, like all guerrilla and terrorist organizations, engage in a high degree of 'internal disciplinary' killing, i.e. the execution of (often merely alleged) informants and wayward (or unreliable) members. Second, there has been a high degree of faction-fighting within nationalist organizations. The Provisional IRA and the Official IRA fought one another in the early 1970s. The Official IRA and the breakaway Irish National Liberation Army killed each other's members in 1975, and more recently in the spring of 1987 INLA imploded in an internal feud which accompanied the formation of IPLO. Third, in the racist language of the British security forces, many of the deaths of nationalist paramilitaries have been due to 'Paddy factors', i.e. bungled actions, such as blowing themselves up by mistake. Such actions were especially common in the Provisional IRA's early days. Since the completion of their organizational 'learning curve' such deaths are now less common, especially given that explosives like Semtex are apparently easier to handle. However, raw and inexperienced IRA recruits are still vulnerable to 'own goals'.
Source: Drawn from IIP Agenda Database
Source: Drawn from IIP Agenda Database
Source: Drawn from IIP Agenda Database
Source: Drawn from IIP Agenda Database
Source: Drawn from IIP Agenda Database
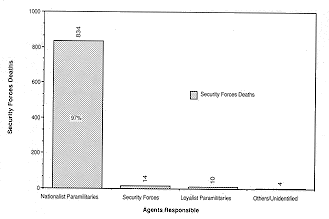
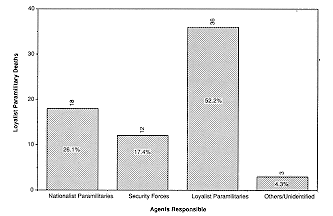
Figure A3.9, which identifies the killers of the security forces, shows that responsibility rests overwhelmingly (97 per cent) with nationalist paramilitaries. The 'Brit factor' ('own goals' or soldiers running amok in barracks) is apparently very low. By contrast Catholic civilians, as shown in Figure A3.10, are killed by a diverse group of agents. Loyalist paramilitaries have killed over half of them. However, nationalist paramilitaries have killed almost 1 in 5 Catholic civilians and have killed more of them than members of the security forces. Figure A3.11 shows that nationalist paramilitaries have killed two-thirds of the Protestant civilians who have died in the 'troubles'. However, loyalist paramilitaries have also been responsible for 1 in 5 of the civilian deaths within their own community. This figure includes those killed in error or as part of 'internal disciplining' of their community. Finally, Figure A3.12 demonstrates the remarkable fact that over half of all deaths (36 out of 69) suffered by loyalist paramilitaries have been caused by other loyalist paramilitaries.
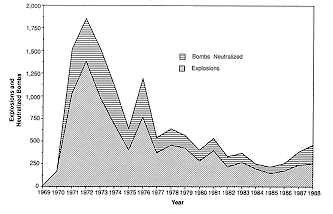
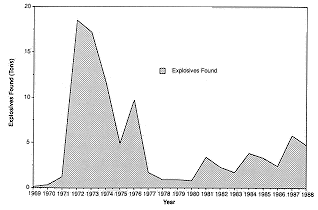
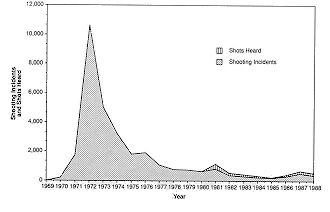
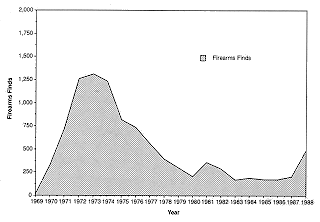
Political violence in Northern Ireland has extended far beyond killings or executions. Data are also available from the RUC on injuries sustained due to the 'troubles', as well as the annual number of explosions, the number of bombs neutralized, the scale of findings of explosives, the number of shooting incidents, the number of firearms finds, the number of armed robberies, and the money taken in armed robberies. The graphics in Figures A3.13-19 illustrate these indicators in turn.
They all show the same pattern as the death-toll data. Very high indicators of violent activity are evident in the years 1971-6 with 'normalization' thereafter. The years 1976-7 were turning-points in the scale of all violence-not simply deaths-for three main reasons. First, the security forces' improved knowledge and capabilities enabled them to dampen down the levels of violence. In particular the ending of internment without trial appears to have helped reduce nationalist militancy after 1976. Second, loyalist paramilitaries dramatically lowered their assassinations and attacks on Catholic civilians. They did so because they believed that the unionist community had beaten back the threat to the integrity of Northern Ireland posed by the civil rights demonstrations, the abolition of Stormont, and the Sunningdale agreement. The opportunities for easy killings had also been reduced by the very extensive resettlement and segregation of Catholics and Protestants after the early years of the 'troubles'- in fact the largest forced population movements in Western Europe since the aftermath of World War II. Finally, nationalist paramilitaries, especially the IRA, reorganized in 1976-7 and changed their strategy. The new cell structure reduced the scale of IRA activities. Combined with their shift from bombing civilian, shopping, and urban centres to attacking military targets the scale of the violence fell in consequence. The propensity of this 'military' violence to cause deaths or injuries to civilians was much lower than the previous combination of 'economic' and 'military' violence.
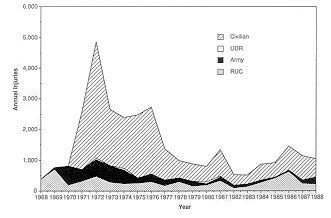
Over 20,000 people have suffered serious injuries since 1969. In a small population of one-and-a-half million people the social impact of such violence is easily imagined. The trends in injuries (Figure A3.13) apparently show that civilians have borne the brunt of the conflict over time. However, the RUC data are unhelpful here because they classify both sets of paramilitaries as civilians. Moreover, in the first three years (1968-70) the RUC data-set implies that no civilians were injured at all (i.e. no data was collected on the question). The data-set is also unhelpful because the RUC do not declare how they tabulate their figures. Originally they referred to injuries caused by terrorism, whereas they now refer to injuries due to the 'security situation' (sic!). In other words it is unclear whether injuries caused by the security forces are included in the figures. It appears that they are, although this would seem to imply that the RUC used to classify injuries caused by the security forces as due to terrorism!
Source: Drawn from RUC data
Source: Drawn from RUC data
Figure A3.14, which shows numbers of explosions and bombs neutralized over time, reveals a similar pattern to all other indicators-i.e. peaks between 1971 and 1976 followed by secular declines thereafter. However, there is no evidence from this figure that 'bomb neutralization' has improved. This fact suggests that there was reason in Peter Brooke's controversial declaration in 1989 that the IRA could not be militarily defeated. Indeed the data on bomb neutralization appear to suggest a deterioration in the capacities of the security forces after 1986. We are unable to confirm whether this trend may be due to increased supplies of Semtex explosives (which are more difficult to detect), reduced use of warnings by nationalist paramilitaries, or even changes in data collection. The figures on weights of explosives found (Figure A3.15) are of questionable significance because technological changes have made the relationships between bomb weight and potency of bomb somewhat indeterminate.[1] However, explosives finds by the security forces do appear to mirror the general level of violence.
Source: Drawn from RUC data
Source: Drawn from RUC data
The evidence on 'shooting incidents' and 'shots heard' (apparently a recent distinction in RUC data collection) is presented in Figure A3.16. While showing a similar trend to other patterns of violence such data by its very nature is much less credible than other indicators of violence. The firearms finds data shown in Figure A3.17 are much more credible and show much the same trend as other indicators of violence, i.e. high figures in the early 1970s followed by decline thereafter. However, whether or not this trend suggests improved control by the security forces or, conversely, greater ability to hide arms on the part of paramilitaries remains a moot point.
Source: Drawn from RUC data
Source: Drawn from RUC data
Sources: Calculated from RUC data and Department of Trade and Industry data
(Central Statistical Office)
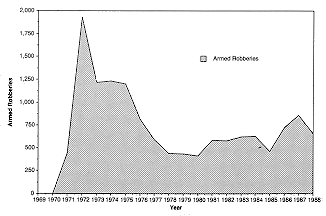
The final RUC data on long-run trends in political violence
tabulate armed robberies (Figure A3.18). Since Northern Ireland
had extraordinarily low rates of 'ordinary, decent' crime before
the late 1960s almost all of the rise in armed robberies is attributable
to the political climate of the 'troubles'. Armed robberies are
one important source of finance for paramilitary organizations.
Other sources include genuine voluntary donations, protection
rackets, 'legitimate' front enterprises, and, in the case of the
IRA, funds from Irish-American organizations (Holland 1987). Unfortunately
the RUC data-unsurprisingly-does not break down the agents responsible
for armed robberies so we have no way of knowing the relative
proportion of nationalist to loyalist armed robberies. However,
what is evident is that the trend in armed robberies displays
a similar pattern to the other indicators of violence. There also
appears to have been a sharp increase in 1986, the year after
the Anglo-lrish Agreement-much sharper than the increase in the
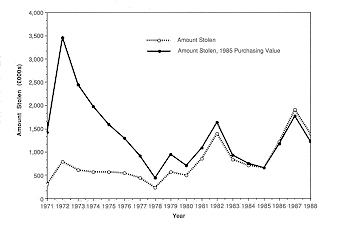
death-rate. Having adjusted the RUC data we can also see in Figure
A3.19 the annual real value of these armed robberies-after adjusting
the nominal values into 1985 prices.
Ultra-nationalists and unionists are both hostile to the Anglo-lrish Agreement. They also share a common interest, albeit for different reasons, in demonstrating that the Anglo-lrish Agreement has not worked in one central respect: the promotion of peace, security, and stability. Consequently these critics of the AIA argue that since November 1985 violence, insecurity, and instability have actually increased. They have some evidence to support their case. Table A3.3 shows that deaths, injuries, shooting incidents, explosions and armed robberies have all gone up significantly in the three years after the AIA by comparison with the three years in the run-up to the Hillsborough accord. Injuries and shooting incidents have gone up by over 50 per cent, armed robberies by 30 per cent and deaths by just over 25 per cent.
| Year | |||||
| 1983 | |||||
| 1984 | |||||
| 1985 | |||||
| Total | |||||
| 1986 | |||||
| 1987 | |||||
| 1988 | |||||
| Rise | |||||
| % | |||||
There can be no doubt that some of the increased violence is attributable to political reactions to the Agreement. There can also be no doubt that in part the rise in violence is explicable by self-fulfilling prophecy. The paramilitaries hostile to the AIA have been doing their best to undermine it. Moreover, unionist demonstrations against the Agreement restored some of the 'street politics' of the early 1970s, and led to increased injuries. Loyalist paramilitaries also increased their assassinations of Catholic civilians after having been dormant for a long time. They also engaged in large-scale intimidation of Catholic civilians and, in the spring of 1986, of RUC officers.
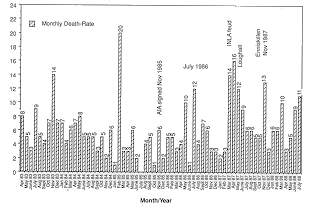
However, it would be a mistake to attribute all the rise in violence in the three years after 1985 to the Agreement itself, just as it would be a mistake to assume that the decline in indicators of violence before November 1985 would have continued indefinitely had there been no change in the constitutional status quo. The monthly death data in the years preceding and succeeding the AIA are shown in Table A3.4 (second column). They are also represented in the histogram Figure A3.20. Inspecting the data in its raw monthly form makes the upward trend after the Agreement much less evident than in the annual data. Moreover, as inspection of the months for 1987 reveals, it is evident that the monthly death-toll was raised considerably in several cases by episodes which are not directly linked to the Agreement: the INLA feud in the spring, the deaths of an IRA unit in a stake-out at Loughall in early summer, and the (allegedly mistaken) IRA killing of Protestant civilians at Enniskillen in November of the same year.
| Month/year | ||||||
| 1983 | ||||||
| April | ||||||
| May | ||||||
| June | ||||||
| July | ||||||
| August | ||||||
| September | ||||||
| October | ||||||
| November | ||||||
| December | ||||||
| 1984 | ||||||
| January | ||||||
| February | ||||||
| March | ||||||
| April | ||||||
| May | ||||||
| June | ||||||
| July | ||||||
| August | ||||||
| September | ||||||
| October | ||||||
| November | ||||||
| December | ||||||
| 1985 | ||||||
| January | ||||||
| February | ||||||
| March | ||||||
| April | ||||||
| May | ||||||
| June | ||||||
| July | ||||||
| August | ||||||
| September | ||||||
| October | ||||||
| November | ||||||
| December | ||||||
TABLE A3.4. (Cont.)
| Month/year | ||||||
| 1986 | ||||||
| January | ||||||
| February | ||||||
| March | ||||||
| April | ||||||
| May | ||||||
| June | ||||||
| July | ||||||
| August | ||||||
| September | ||||||
| October | ||||||
| November | ||||||
| December | ||||||
| 1987 | ||||||
| January | ||||||
| February | ||||||
| March | ||||||
| April | ||||||
| May | ||||||
| June | ||||||
| July | ||||||
| August | ||||||
| September | ||||||
| October | ||||||
| November | ||||||
| December | ||||||
| 1988 | ||||||
| January | ||||||
| February | ||||||
| March | ||||||
| April | ||||||
| May | ||||||
| June | ||||||
| July | . | |||||
Source: (2nd col.) IIP, Agenda Database.
Calculated as in Hartwig and Dearing (1979: 36-9).
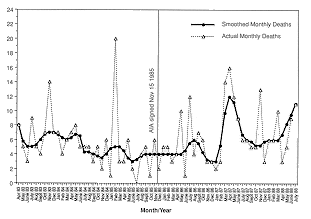
When the monthly death data are smoothed, using the standard technique
in exploratory data analysis of running medians and harming (Hartwig
and Dearing 1979: 36-9), a pre-Agreement downward trend and a
post-Agreement upward trend in deaths are much more apparent (see
Figure A3.21). However, the rise is not especially dramatic. Indeed
much of the deterioration in the smoothed monthly figures comes
after the spring of 1986 - after the IRA received extensive reinforcements
of matériel from Libya. Finally, one might even
argue that the impact of the AIA has been relatively low-key given
the ferocity of unionist opposition to it. The predictions of
a loyalist backlash on the scale of the early 1970s have so far
not been fulfilled - even though loyalist paramilitary killings
have increased since November 1985.
Source: Calculated from IIP, Agenda Database
Source: Calculated from IIP, Agenda Database
Judging by the preliminary and unconfirmed figures for 1989, the death-toll in Northern Ireland will fall by comparison with the previous two years - although the IRA have caused many deaths outside Northern Ireland, in places as diverse as England, The Netherlands, and West Germany. Indeed the Provisional IRA may well have decided that campaigning outside Northern Ireland against 'soft' British military targets is a more effective way of destabilizing the AIA. However, within Northern Ireland, policy-makers in the 1990s, benefiting from the improved security cooperation between the British and Irish states, have good reasons to believe that the scale of the conflict can be reduced to its pre-Hillsborough levels-although they have no reason for being too sanguine.
Notes
[1] It is wholly unclear from the RUC data whether or not the weight
of explosives finds are expressed in TNT impact-weight or simple
weight in pounds.
CAIN
contains information and source material on the conflict
and politics in Northern Ireland. CAIN is based within Ulster University. |
|
|
|||
|
Last modified :
|
||
|
| ||
