 CAIN Web Service
Background Information on Northern Ireland Society - Tourism
[CAIN_Home]
[Key_Events]
[Key_Issues]
[Conflict_Background]
NI SOCIETY:
[Agriculture]
[Art_&_Literature]
[Culture]
[Economy]
[Education]
[Employment]
[Geography]
[Health_&_Social_Security]
[History]
[Housing]
[Income]
[Law_&_Order]
[Media]
[Politics]
[Population]
[Religion]
[Security]
[Tourism]
[Transportation]
Page Compiled: Fionnuala McKenna and Brendan Lynn
Material is added to this site on a regular basis - information on this page may change
Tourism in Northern Ireland
Summary
The internationally accepted definition of a tourist is "any
visitor staying at least twenty-four hours in the country visited".
This definition has been used to determine the number of visitors
to Northern Ireland in the tables and statistics listed below.
The Northern Ireland Tourist Board is responsible for the
development of tourism in Northern Ireland and the promotion of
the area as a tourist destination. It is a non-departmental public
body of the Department of Economic Development, and was constituted
under the Tourism (Northern Ireland) Order 1992.
In 1997, Northern Ireland had a total of 1.415 million visitors,
generating £208 million revenue, which in turn represented
1.8% of Northern Ireland's Gross Domestic Product.
The majority of visitors to Northern Ireland over the years
(on average 57%) have consistently been from England, Scotland
and Wales, and the main reason for travel was to visit friends
and relatives in Northern Ireland.
The number of visitors to Northern Ireland increased from
1.29 million in 1994 to 1.55 million in 1995 following the Republican and Loyalist Ceasefires.
This number subsequently fell in 1996 to 1.43 million, and again
in 1997 to 1.415 million (this was mainly due to a return to violence when the IRA ended its ceasefire on 9 February 1996; the ceasefire was reinstated on 20 July 1997).
The percentage number of visitors to Northern during peak
holiday season, that is July to September, decreased from 36% in 1995
to 32% in 1997. This decline was in response to the political distrubances surrounding the disputed Orange Order march from Drumcree down through the Garvaghy Road in Portadown. The first stand-off occurred on 9 July 1995 and there was trouble associated with the march in subsequent years.
Sources:
The following tables provide breakdowns of statistics for Tourism in Northern Ireland. Much of this material has been taken from the 'Northern Ireland Annual Abstract of Statistics',
the 'Irish Almanac and Yearbook of Facts', and 'Tourism Facts', produced annually by the Northern Ireland Tourist Board.
Readers may also find useful information at the Northern Ireland Tourist Board (NITB) web site {external_link}.
Tourist Information on the Republic of Ireland can be found at the Board Fáilte website {external_link}.
List of Tables
Table NI-TOU-01: Visitor trips (number) to Northern Ireland, nights spent (number), and revenue generated (£million), 1963, 1967, 1972, and 1988 to 2001
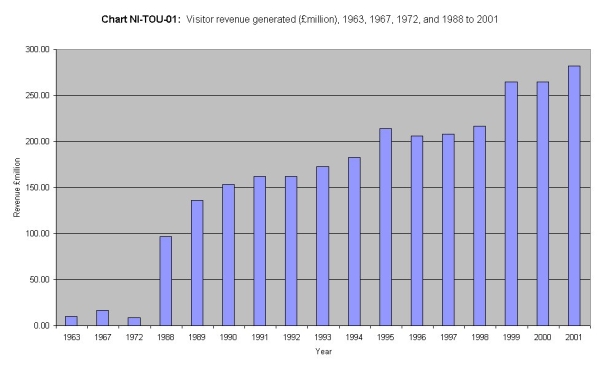
Chart NI-TOU-01: Visitor revenue generated (£million), 1963, 1967, 1972, and 1988 to 2001
Table: NI-TOU-02: Tourism in Northern Ireland: visitors, revenue, and purpose of visit (units as indicated), 1992 to 2001
Table NI-TOU-03: Staying visitors to Northern Ireland: by country of origin, and by number of trips, nights, and money spent (units as indicated), 1996 to 2001
Table NI-TOU-04: Visitor trips (percentage) to Northern Ireland by country of origin, 1996 to 2001
Table NI-TOU-05: Main purpose of visit (%) to Northern Ireland by country of origin, 2001
Table NI-TOU-06: Methods of Arrival / Departure (%) used by visitors to Northern Ireland by County of Origin, 2001
Table NI-TOU-07: Type of accommodation (%) used by visitors, 2001
Table NI-TOU-08: Expenditure by visitors (%) by purpose of visit, 2001
Table NI-TOU-09: Time of year in which visitors (%) travelled to Northern Ireland, by purpose of visit, 2001
Table NI-TOU-10: Top 20 Northern Ireland tourist attractions and number of visitors, 2001
Table NI-TOU-11: Type and amount (numbers) of accomodation available to tourists, 1991 to 2001
Table NI-TOU-12: Occupancy rates (%) in Northern Ireland hotels, 1991-2001
See also: Tables with earlier data
|
Table NI-TOU-01: Visitor trips (number) to Northern Ireland, nights spent (number), and revenue generated (£million), 1963, 1967, 1972, and 1988 to 2001 |
|
Year |
Trips |
Nights |
Revenue (£m) |
|
1963 |
704,600 |
7,670,900 |
10.14 |
|
1967 |
108,000 |
8,679,400 |
16.94 |
|
1972 |
435,000 |
3,499,400 |
8.64 |
|
1988 |
930,400 |
6,673,900 |
97.00 |
|
1989 |
1,090,600 |
6,636,400 |
136.31 |
|
1990 |
1,152,800 |
7,091,000 |
153.09 |
|
1991 |
1,186,100 |
7,160,000 |
162.00 |
|
1992 |
1,254,500 |
7,466,600 |
161.67 |
|
1993 |
1,262,000 |
7,794,000 |
173.00 |
|
1994 |
1,293,900 |
7,804,000 |
183.00 |
|
1995 |
1,557,000 |
8,500,000 |
214.00 |
|
1996 |
1,436,000 |
7,700,000 |
206.00 |
|
1997 |
1,415,000 |
7,500,000 |
208.00 |
|
1998 |
1,477,000 |
7,835,000 |
217.00 |
|
1999 |
1,655,000 |
8,768,000 |
265.00 |
|
2000 |
1,672,000 |
8,693,000 |
265.00 |
|
2001 |
1,676,000 |
8,692,000 |
282.00 |
|
Source: |
|
Northern Ireland Tourism Board web site (www.nitb.com), Tourism Facts 2001 p.2. |
|
Table also available as: |
|
Rich Text Format (RTF) Document; Microsoft Excel Document |
|
Table: NI-TOU-02: Tourism in Northern Ireland: visitors, revenue, and purpose of visit (units as indicated), 1992 to 2001 |
|
Visitors, revenue and purpose of visit |
1992 |
1993 |
1994 |
1995 |
1996 |
1997 |
1998 |
1999 |
2000 |
2001 |
|
Staying visitors |
|
|
|
|
|
|
|
|
|
|
|
From Great Britain (000s) |
726 |
704 |
708 |
810 |
825 |
799 |
838 |
1,002 |
950 |
1,053 |
|
From Irish Republic (000s) |
352 |
373 |
390 |
470 |
370 |
345 |
360 |
384 |
380 |
365 |
|
From overseas (000s) |
176 |
185 |
196 |
277 |
241 |
271 |
279 |
269 |
341 |
258 |
|
All staying visitors (000s) |
1,254 |
1,262 |
1,294 |
1,557 |
1,436 |
1,415 |
1,477 |
1,655 |
1,672 |
1,676 |
|
All revenue (£ millions) |
162 |
173 |
183 |
214 |
206 |
208 |
217 |
265 |
265 |
282 |
|
Purpose of visit |
|
|
|
|
|
|
|
|
|
|
|
Visiting friends or relatives (000s) |
510 |
519 |
522 |
564 |
590 |
577 |
617 |
684 |
743 |
773 |
|
% |
41 |
41 |
40 |
36 |
41 |
41 |
42 |
41 |
44 |
46 |
|
Holiday (000s) |
247 |
251 |
275 |
461 |
297 |
263 |
277 |
305 |
306 |
274 |
|
% |
20 |
20 |
21 |
30 |
21 |
19 |
19 |
18 |
18 |
16 |
|
Business (000s) |
380 |
378 |
388 |
402 |
409 |
419 |
434 |
501 |
464 |
501 |
|
% |
30 |
30 |
30 |
26 |
28 |
29 |
29 |
30 |
28 |
30 |
|
Other (000s) |
117 |
114 |
109 |
130 |
140 |
156 |
149 |
165 |
159 |
128 |
|
% |
9 |
9 |
9 |
8 |
10 |
11 |
10 |
10 |
10 |
8 |
|
All visits (000s) |
1,254 |
1,262 |
1,294 |
1,557 |
1,436 |
1,415 |
1,477 |
1,655 |
1,672 |
1,676 |
|
Source: |
|
Northern Ireland Annual Abstract of Statistics 2002, Table 9.14 |
|
Table also available as: |
|
Rich Text Format (RTF) Document; Microsoft Excel Document |
|
Table NI-TOU-03: Staying visitors to Northern Ireland: by country of origin, and by number of trips, nights, and money spent (units as indicated), 1996 to 2001 |
| |
|
1996 |
1997 |
1998 |
1999 |
2000 |
2001 |
|
England |
trips ('000) |
588 |
571 |
578 |
707 |
662 |
718 |
| |
nights ('000) |
3,225 |
3,108 |
3,060 |
3,839 |
3,384 |
3,714 |
| |
spending (£m) |
82 |
85 |
89 |
115 |
109 |
137 |
|
Scotland |
trips ('000) |
221 |
214 |
243 |
276 |
270 |
314 |
| |
nights ('000) |
971 |
1,004 |
1,067 |
1,385 |
1,204 |
1,357 |
| |
spending (£m) |
25 |
26 |
29 |
43 |
35 |
48 |
|
Wales |
trips ('000) |
16 |
14 |
17 |
19 |
19 |
21 |
| |
nights ('000) |
81 |
71 |
90 |
102 |
98 |
109 |
| |
spending (£m) |
2 |
2 |
3 |
3 |
3 |
4 |
|
Great Britain |
trips ('000) |
825 |
799 |
838 |
1,002 |
950 |
1,053 |
| |
nights ('000) |
4,277 |
4,183 |
4,217 |
5,327 |
4,686 |
5,180 |
| |
spending (£m) |
110 |
113 |
120 |
161 |
147 |
189 |
|
Republic of Ireland |
trips ('000) |
370 |
345 |
360 |
384 |
380 |
365 |
| |
nights ('000) |
1,207 |
1,086 |
1,187 |
1,223 |
1,227 |
940 |
| |
spending (£m) |
30 |
27 |
28 |
31 |
30 |
26 |
|
North America |
trips ('000) |
100 |
109 |
115 |
123 |
148 |
102 |
| |
nights ('000) |
851 |
909 |
809 |
794 |
1,155 |
902 |
| |
spending (£m) |
29 |
31 |
30 |
33 |
45 |
30 |
|
Europe |
trips ('000) |
97 |
105 |
108 |
92 |
126 |
106 |
| |
nights ('000) |
817 |
760 |
922 |
750 |
913 |
990 |
| |
spending (£m) |
22 |
21 |
25 |
19 |
21 |
20 |
|
Austrailia / New Zealand |
trips ('000) |
29 |
39 |
35 |
35 |
42 |
30 |
| |
nights ('000) |
248 |
312 |
257 |
315 |
369 |
301 |
| |
spending (£m) |
5 |
9 |
6 |
9 |
9 |
8 |
|
Other Overseas |
trips ('000) |
15 |
18 |
21 |
19 |
25 |
20 |
| |
nights ('000) |
299 |
259 |
443 |
359 |
344 |
379 |
| |
spending (£m) |
10 |
7 |
8 |
11 |
13 |
9 |
|
Total Staying Visitors |
trips ('000) |
1,436 |
1,415 |
1,477 |
1,655 |
1,672 |
1,676 |
| |
nights ('000) |
7,700 |
7,500 |
7,835 |
8,768 |
8,693 |
8,692 |
| |
spending (£m) |
206 |
208 |
217 |
265 |
265 |
282 |
|
Source: |
|
Northern Ireland Tourism Board web site (www.nitb.com), Tourism Facts 2001 p.3. |
|
Table also available as: |
|
Rich Text Format (RTF) Document; Microsoft Excel Document |
|
Table NI-TOU-04: Visitor trips (percentage) to Northern Ireland by country of origin, 1996 to 2001 |
| |
1996 |
1997 |
1998 |
1999 |
2000 |
2001 |
|
Trips ('000) |
1,436 |
1,415 |
1,477 |
1,655 |
1,672 |
1,676 |
|
Total (%) |
100% |
100% |
100% |
100% |
100% |
100% |
|
Origin |
|
|
|
|
|
|
|
England |
41 |
41 |
39 |
43 |
40 |
43 |
|
Scotland |
15 |
15 |
17 |
17 |
16 |
19 |
|
Wales |
1 |
1 |
1 |
1 |
1 |
1 |
|
Total Great Britain |
57 |
57 |
57 |
61 |
57 |
63 |
|
Republic of Ireland |
26 |
24 |
24 |
23 |
23 |
22 |
|
North America |
7 |
8 |
8 |
7 |
9 |
6 |
|
Europe |
7 |
7 |
7 |
6 |
8 |
6 |
|
Australia/New Zealand |
2 |
3 |
2 |
2 |
3 |
2 |
|
Other Overseas |
1 |
1 |
1 |
1 |
1 |
1 |
|
Source: |
|
Northern Ireland Tourism Board web site (www.nitb.com), Tourism Facts 2001 p.3. |
|
Table also available as: |
|
Rich Text Format (RTF) Document; Microsoft Excel Document |
|
Table NI-TOU-05: Main purpose of visit (%) to Northern Ireland by country of origin, 2001 |
| |
Visiting friends and relatives |
Holiday |
Business |
Other |
|
Country of Origin |
% |
% |
% |
% |
|
England |
52 |
6 |
39 |
3 |
|
Scotland |
51 |
14 |
31 |
4 |
|
Wales |
34 |
4 |
54 |
8 |
|
Republic of Ireland |
39 |
24 |
18 |
19 |
|
North America |
34 |
44 |
13 |
9 |
|
Europe |
30 |
34 |
26 |
10 |
|
Australia/New Zealand |
47 |
47 |
3 |
3 |
|
Elsewhere |
45 |
20 |
20 |
10 |
|
Source: |
|
Northern Ireland Tourism Board web site (www.nitb.com), Tourism Facts 2001 p.4. |
|
Table also available as: |
|
Rich Text Format (RTF) Document; Microsoft Excel Document |
|
Table NI-TOU-06: Methods of Arrival / Departure (%) used by visitors1 to Northern Ireland by County of Origin, 2001 |
| |
By air |
By sea |
Via Republic of Ireland |
|
Country of Origin |
% |
% |
% |
|
Great Britain |
56 |
40 |
4 |
|
Europe |
52 |
14 |
34 |
|
North America |
36 |
18 |
45 |
|
Australia/New Zealand |
44 |
20 |
36 |
|
Elsewhere |
69 |
10 |
20 |
|
Total |
54 |
35 |
11 |
|
Notes: |
|
1. Excludes Republic of Ireland residents. |
|
Source: |
|
Northern Ireland Tourism Board web site (www.nitb.com), Tourism Facts 2001 p.4. |
|
Table also available as: |
|
Rich Text Format (RTF) Document; Microsoft Excel Document |
|
Table NI-TOU-07: Type of accommodation (%) used by visitors, 20011 |
| |
Trips |
Nights |
Spending |
|
Total |
1,676,000 |
8,692,000 |
£282m |
|
% |
100% |
100% |
100% |
|
Type of accommodation |
|
|
|
|
Hotel |
28 |
13 |
35 |
|
Guesthouse/Bed and breakfast |
11 |
7 |
10 |
|
Caravan/Camping |
1 |
1 |
1 |
|
Rented accommodation |
2 |
6 |
4 |
|
Staying with friends/relatives |
55 |
64 |
43 |
|
Other (e.g. youth hostels) |
4 |
9 |
7 |
|
Notes: |
|
1. These tables should be treated with caution due to limitations with information sources. |
|
Source: |
|
Northern Ireland Tourism Board web site (www.nitb.com), Tourism Facts 2001 p.4. |
|
Table also available as: |
|
Rich Text Format (RTF) Document; Microsoft Excel Document |
|
Table NI-TOU-08: Expenditure by visitors (%) by purpose of visit, 20011 |
| |
Visiting friends & relatives |
Holiday |
Business |
All |
|
Spend (£m) |
111 |
39 |
110 |
282 |
|
Total % |
100% |
100% |
100% |
100% |
|
Accommodation/meals |
24 |
42 |
65 |
43 |
|
Internal travel |
9 |
11 |
14 |
11 |
|
Entertainment (inc. drinks) |
19 |
17 |
12 |
16 |
|
Shopping |
43 |
28 |
6 |
28 |
|
(Presents) |
14 |
11 |
2 |
9 |
|
Incidental expenditure |
4 |
3 |
3 |
4 |
|
Notes: |
|
1. These tables should be treated with caution due to limitations with information sources |
|
Source: |
|
Northern Ireland Tourism Board web site (www.nitb.com), Tourism Facts 2001 p.4. |
|
Table also available as: |
|
Rich Text Format (RTF) Document; Microsoft Excel Document |
|
Table NI-TOU-09: Time of year in which visitors (%) travelled to Northern Ireland, by purpose of visit, 20011 |
| |
Visiting friends & relations |
Holiday |
Business |
All |
|
Trips ('000) |
773 |
274 |
501 |
1,676 |
|
Total % |
100% |
100% |
100% |
100% |
|
January-March |
18 |
13 |
21 |
18 |
|
April-June |
24 |
23 |
27 |
25 |
|
July-September |
34 |
50 |
25 |
33 |
|
October-December |
24 |
14 |
27 |
23 |
|
Notes: |
|
1. These tables should be treated with caution due to limitations with information sources |
|
Source: |
|
Northern Ireland Tourism Board web site (www.nitb.com), Tourism Facts 2001 p.4. |
|
Table also available as: |
|
Rich Text Format (RTF) Document; Microsoft Excel Document |
|
Table NI-TOU-10: Top 20 Northern Ireland tourist attractions and number of visitors, 2001 |
|
Rank |
Tourist Attraction |
Number of visitors |
|
1 |
Giant's Causeway Visitor Centre* |
383,133 |
|
2 |
W5 |
200,893 |
|
3 |
Ulster Museum F |
195,916 |
|
4 |
Pickie Family Fun Park* |
190,000 |
|
5 |
Belfast Zoo |
172,323 |
|
6 |
Oxford Island Nature Reserve F |
163,733 |
|
7 |
Belleek Pottery* |
142,557 |
|
8 |
Portstewart Strand |
130,431 |
|
9 |
Exploris* |
127,200 |
|
10 |
Ulster Folk and Transport Museum |
119,848 |
|
11 |
Ulster American Folk Park |
110,533 |
|
12 |
Old Bushmills Distillery |
97,130 |
|
13 |
Carrick-a-Rede Rope Bridge |
94,382 |
|
14 |
Saint Patrick Centre |
84,995 |
|
15 |
Dunluce Centre* |
75,920 |
|
16 |
Waterworld |
72,522 |
|
17 |
Castle Espie Wildfowl & Wetland Centre |
64,600 |
|
18 |
Malone House* F |
62,500 |
|
19 |
North Down Heritage Centre |
51,795 |
|
20 |
Portrush Countryside Centre* F |
49,500 |
|
Notes: |
|
* Estimate |
|
F Free admission |
|
Source: |
|
Northern Ireland Tourism Board web site (www.nitb.com), Tourism Facts 2001 p.5. |
|
Also available as: |
|
Rich Text Format (RTF) Document; Microsoft Excel Document |
|
Table NI-TOU-11: Type and amount (numbers) of accomodation available to tourists, 1991 to 2001 |
|
Year |
Hotels |
Guesthouses |
Self-catering |
Other accomodation |
|
Numbers |
Bedrooms |
Numbers |
Bedrooms |
Numbers |
Bedrooms |
Numbers |
Bedrooms |
|
1991 |
126 |
3,278 |
146 |
1,081 |
134 |
785 |
693 |
4,543 |
|
1992 |
126 |
3,284 |
147 |
1,128 |
158 |
857 |
703 |
4,456 |
|
1993 |
123 |
3,388 |
140 |
1,007 |
207 |
1,150 |
630 |
4,847 |
|
1994 |
126 |
3,537 |
150 |
1,086 |
266 |
1,470 |
684 |
5,244 |
|
1995 |
129 |
3,678 |
162 |
1,186 |
338 |
1,899 |
869 |
5,962 |
|
1996 |
135 |
3,975 |
159 |
1,200 |
378 |
2,033 |
1,011 |
6,538 |
|
1997 |
137 |
4,469 |
159 |
1,234 |
408 |
2,310 |
991 |
6,531 |
|
1998 |
137 |
4,899 |
160 |
1,257 |
436 |
2,328 |
952 |
6,642 |
|
1999 |
133 |
4,893 |
148 |
1,154 |
483 |
2,524 |
954 |
6,655 |
|
2000 |
130 |
4,957 |
153 |
1,169 |
532 |
2,714 |
932 |
6,674 |
|
2001 |
133 |
5,295 |
156 |
1,192 |
563 |
2,978 |
862 |
6,476 |
|
Source: |
|
Northern Ireland Tourism Board web site (www.nitb.com), Tourism Facts 2001 p.5-6. |
|
Table also available as: |
|
Rich Text Format (RTF) Document; Microsoft Excel Document |
|
Table NI-TOU-12: Occupancy rates (%) in Northern Ireland hotels, 1991-20011 |
|
January-December period |
Room occupancy |
Bedspace occupancy |
Visitor content |
|
1991 |
49 |
33 |
56 |
|
1992 |
47 |
32 |
54 |
|
1993 |
48 |
32 |
61 |
|
1994 |
51 |
31 |
61 |
|
1995 |
62 |
41 |
68 |
|
1996 |
56 |
35 |
65 |
|
19972 |
53 |
33 |
62 |
|
1998 |
53 |
32 |
62 |
|
1999 |
53 |
34 |
65 |
|
2000 |
53 |
33 |
64 |
|
2001 |
53 |
33 |
61 |
|
Notes: |
|
1. The occupancy rate represents the number of rooms or bedspaces taken in a given period as a percentage of the total rooms or bedspaces on offer. Double or twin-bedded rooms count as having two bedspaces. Visitor content is the percentage of all guests registered who come from outside Northern Ireland. |
|
2. A new survey methodology was introduced in 1997 and therefore data pre-1997 is not directly comparable with that post-1997. |
|
Source: |
|
Northern Ireland Tourism Board web site (www.nitb.com), Tourism Facts 2001 p.7. |
|
Table also available as: |
|
Rich Text Format (RTF) Document; Microsoft Excel Document |
|


