
Comparative Perspectives on Housing Segregation
|
|
Segregation Dimension |
Measures |
Score |
| Evenness | The most widely used measure of evenness; dissimilarity measures the proportion of members of one group that would have to change their area of residence to achieve perfect integration. |
1 -> 1.0 0 = No Segregation 1 = Maximum Segregation High = .600 + |
| Exposure | Exposure measures the extent to which groups are exposed only to each other in their areas of residence. Commonly used exposure measures are Isolation and/or Correlation (Eta). |
0 -> 1.0 0 = Interaction 1 = Isolation High = .700 + |
| Clustering | Clustering measures the extent to which census tracts inhabited by subordinate groups are contiguous. |
0 -> 1.0+ >1 = Dominant/Subordinate Groups live closer to each other than to their own groups 1 = No differential clustering 1.0+ = Dominant /Subordinate groups live closer to one another than to members of the other group. |
| Centralization | Centralization measures the extent to which a group is spatially located near the center of an urban area. |
-1.0 -> +1.0 -1 = Tendency to reside in outlying areas +1 = Tendency to reside close to city center 0=Uniform distribution High = .800 + |
| Concentration | Concentration measures the amount of physical space occupied by subordinate groups so that as segregation increases subordinate groups are increasingly concentrated in smaller areas. |
-1.0 -> +1.0 -1.0 = Concentration of one group exceeds the other to the maximum possible extent 1 = Opposite concentration 0=Two groups equally concentrated High = .700 + |
All six of the "hypersegregated" metropolitan areas are located in an area known as the Frostbelt region. (The region is known as the Frostbelt because the winters are too long and cold which, of course, means the summers are far too short.)
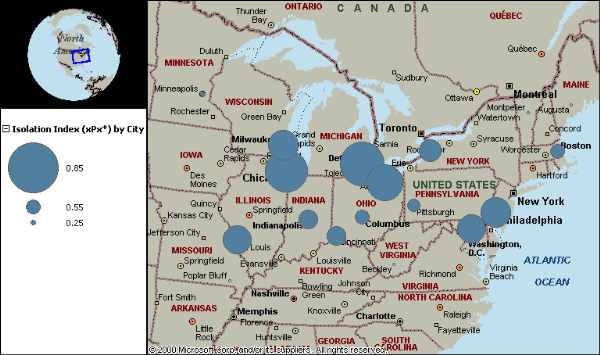
1990 census data indicate five out of the six metropolitan areas earning Massey and Dentons dubious distinction of being the most segregated metropolitan areas in the US in 1980 again exceeded all five measures in 1990. Chicago was the only metropolitan area not exceeding all five-dimension thresholds in 1990. Chicagos centralization dropped from .872 in 1980 to .722 in 1990, but the other four dimensions, dissimilarity, isolation, clustering, and concentration exceeded the Massey and Dentons suggested thresholds. Table 1.2 lists comparative 1990 residential segregation data for the Frostbelts fourteen largest metropolitan areas (excluding New York, New York). Map 1.1 illustrates 1990 comparative isolation indices for Frostbelt metropolitan areas listed in Table 1.2.
Table 1.2 Residential Segregation in US Frostbelt Cities
Five Measures of Segregation (1990)
|
MSA / PMSA Name |
Percent Minority Population |
CENTRAL |
CONCEN |
EVENNESS |
CLUSTERING |
EXPOSURE |
EXPOSURE |
| Baltimore, MD |
25.9% |
0.847 |
0.921 |
0.715 |
1.602 |
0.709 |
0.602 |
| Boston, MA |
6.6% |
0.849 |
0.958 |
0.695 |
1.504 |
0.546 |
0.511 |
| Buffalo, NY |
10.3% |
0.836 |
0.984 |
0.800 |
1.478 |
0.651 |
0.610 |
| Chicago, IL |
19.3% |
0.722 |
0.929 |
0.842 |
1.858 |
0.814 |
0.760 |
| Cincinnati, OH |
12.5% |
0.921 |
0.979 |
0.767 |
1.372 |
0.617 |
0.561 |
| Cleveland, OH |
17.3% |
0.880 |
0.971 |
0.826 |
1.825 |
0.773 |
0.724 |
| Columbus, OH |
12.1% |
0.875 |
0.966 |
0.683 |
1.331 |
0.539 |
0.473 |
| Detroit, MI |
22.1% |
0.878 |
0.974 |
0.874 |
1.853 |
0.823 |
0.771 |
| Indianapolis, IN |
13.2% |
0.866 |
0.970 |
0.751 |
1.453 |
0.604 |
0.542 |
| Milwaukee WI |
13.8% |
0.889 |
0.976 |
0.826 |
1.761 |
0.725 |
0.678 |
| Minneapolis, MN |
3.5% |
0.938 |
0.978 |
0.622 |
1.162 |
0.296 |
0.268 |
| Philadelphia, PA |
19.1% |
0.822 |
0.918 |
0.769 |
1.688 |
0.720 |
0.649 |
| Pittsburgh, PA |
7.5% |
0.831 |
0.967 |
0.708 |
1.281 |
0.518 |
0.479 |
| St. Louis, MO |
17.0% |
0.913 |
0.966 |
0.782 |
1.637 |
0.707 |
0.646 |
| US Frostbelt Median |
13.5% |
0.871 |
0.969 |
0.768 |
1.553 |
0.679 |
0.606 |
Map 1.1 US Frostbelt Isolation Indices, 1990
There are many causes of residential segregation. Individual choices to live in one area versus another is a certainly a primary cause of segregation. However, individual choices may be limited by constraints outside individual control. In the case of housing choices, constraints outside the control of individuals include available such things as the availability of affordable housing and discrimination (by mortgage lenders for buyers and by landlords for renters). One possible reason why Metropolitan Milwaukee ranks so highly on segregation is that Metropolitan Milwaukee had the highest racial loan gap for nine straight years (the difference between the rate of home mortgage loans approved for whites and those approved for blacks) (Milwaukee Journal Sentinel 1999 and Adversity).
Residential segregation also has many unintended consequences. Research has shown that segregation is linked to the economic fortunes and life changes of those living within highly segregated areas. One of the most negative affects of hypersegregation, as posited by Massey and Denton, is its relationship to concentrated poverty and related social dislocation problems (William Julius Wilson 1987) experienced by those living in such areas. Metropolitan Milwaukee also demonstrates unintended consequences of hypersegregation: Milwaukee had the highest ratio of black/white unemployment disparities from 1970 to 1996. In 1990, the area had the highest proportion of blacks living in higher poverty neighborhoods in the Frostbelt region (CED-UWM).
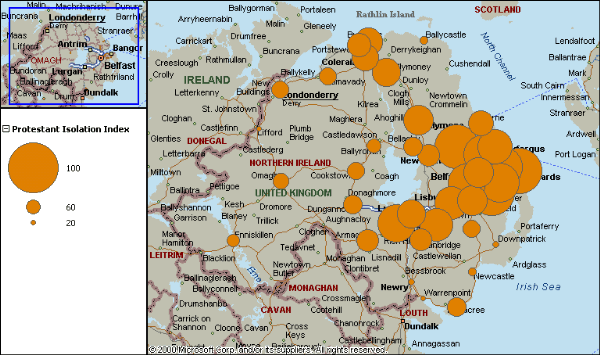
How do patterns of residential segregation in Northern Ireland compare to the same patterns in US Frostbelt metropolitan areas? Michael A. Poole and Paul Doherty (1996) compared residential segregation patterns in 39 Northern Ireland towns using 1981 census data. Poole and Doherty used two measures of Evenness (dissimilarity and replacement) and two measures of Exposure (isolation and Eta Squared) as well as a measure they called "Linear Dominance" to compare these 39 Northern Ireland towns (Appendix 1). Maps 1.2 and 1.3 represent Protestant and Catholic isolation indices as found by Poole and Doherty.
Map 1.2 Protestant Isolation in Northern Ireland, 1981
Map 1.3 Catholic Isolation in Northern Ireland, 1981
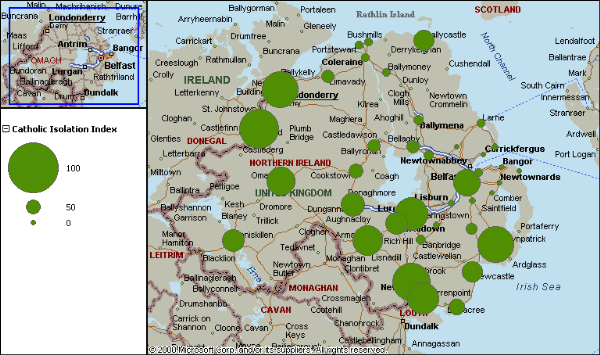
Maps 1.2 and 1.3 illustrate the rather symmetrical pattern of Northern Irelands residential isolation (exposure): towns in eastern Northern Ireland have higher Protestant isolation indices while those in western Northern Ireland have higher Catholic isolation indices. The numerical scale Poole and Doherty used for measuring segregation was a 1-100 rather scale than the 0.1-1 scale used by Massey and Denton. In the Northern Ireland case, therefore, an index above 70 indicates a high degree of isolation. Thirty of the towns studied by Poole and Doherty had isolation indices above 70 for either one of the groups (Catholics and Protestants). Table 1.3 lists the 30 towns for which either the Protestant or Catholic isolation index was above 70. (The table is sorted by the Catholic isolation index.)
Table 1.3 Northern Ireland Towns with Isolation Indices above 70 (1981)
|
Town |
EXPOSURE |
EXPOSURE |
Town |
EXPOSURE |
EXPOSURE |
|
Strabane |
89.7 |
20.6 |
Cookstown |
48.5 |
65.9 |
|
Newry |
88.7 |
32.6 |
Randalstown |
44.2 |
67.9 |
|
Derry |
86.8 |
66.8 |
Magherafelt |
44.2 |
58.1 |
|
Downpatrick |
86.8 |
34.2 |
Limavady |
42.2 |
64.6 |
|
Lurgan |
82.5 |
81.2 |
Ballynahinch |
38.5 |
65.4 |
|
Warrenpoint |
80.3 |
21.8 |
Antrim |
33.5 |
73.2 |
|
Armagh |
79.6 |
74.3 |
Ballymena |
33.1 |
82.4 |
|
Omagh |
75.7 |
63.2 |
Banbridge |
31.4 |
74.1 |
|
Belfast |
74.0 |
91.0 |
Larne |
29.1 |
77.3 |
|
Dungannon |
70.7 |
68.3 |
Portstewart |
24.9 |
76.1 |
|
Portadown |
67.6 |
90.5 |
Coleraine |
24.3 |
79.8 |
|
Enniskillen |
65.2 |
57.0 |
Ballymoney |
23.7 |
82 |
|
Ballycastle |
65.0 |
37.9 |
Portrush |
23.5 |
81.3 |
|
Newcastle |
63.2 |
43.2 |
Holywood |
22.7 |
83.5 |
|
Kilkeel |
53.6 |
69.2 |
Lisburn |
20.9 |
86.8 |
Map 1.4 portrays the dissimilarity (evenness) comparisons of the 39 towns. Five of the 30 towns had dissimilarity indices above 60: Armagh, Belfast, Derry, Lurgan and Portadown. Table 1.4 lists the dissimilarity indices of the 39 towns (sorted by dissimilarity). Those towns that have dissimilarity indices above 60 have high degrees of dissimilarity.
Map 1.4 Dissimilarity Indices of 39 Towns in Northern Ireland, 1981
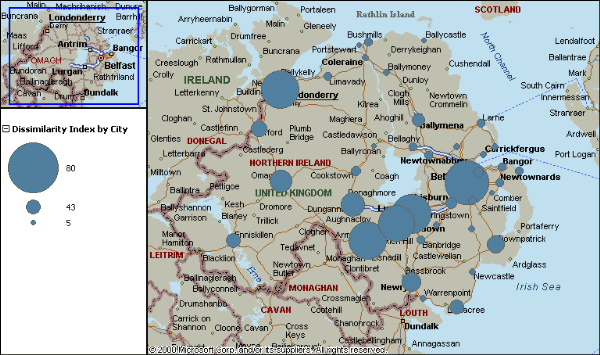
Table 1.4 - Dissimilarity Indices of 39 Towns in Northern Ireland (1981)
|
Town |
Dissimilarity Index |
Town |
Dissimilarity Index |
Town |
Dissimilarity Index |
|
Belfast |
76.0 |
Holywood |
29.1 |
Ballyclare |
19.8 |
|
Lurgan |
72.9 |
Bangor |
26.7 |
Coleraine |
19.6 |
|
Armagh |
72.0 |
Newtownards |
26.3 |
Ballynahinch |
19.1 |
|
Derry |
70.9 |
Randalstown |
24.4 |
Whitehead |
16.7 |
|
Portadown |
70.3 |
Antrim |
23.8 |
Warrenpoint |
16.4 |
|
Dungannon |
56.9 |
Donaghadee |
23.2 |
Ballycastle |
13.9 |
|
Omagh |
55.3 |
Larne |
22.8 |
Comber |
13.5 |
|
Newry |
51.3 |
Limavady |
22.3 |
Magherafelt |
11.7 |
|
Downpatrick |
46.6 |
Banbridge |
22.2 |
Portstewart |
8.6 |
|
Strabane |
43.2 |
Carryduff |
21.9 |
||
|
Kilkeel |
42.9 |
Portrush |
21.9 |
||
|
Enniskillen |
42.8 |
Newcastle |
21.1 |
||
|
Ballymena |
38.2 |
Carrickfergus |
20.0 |
||
|
Lisburn |
32.4 |
Dromore |
20.0 |
||
|
Cookstown |
31.3 |
Ballymoney |
19.9 |
Poole and Doherty used another evenness dimension measurement, which they called the "Linear Dominance Index" (LD). Poole and Doherty contend LD, while sharing the measurement of deviation from a benchmark with other measures of evenness such as dissimilarity and replacement is different from them. The way LD works is that if it is assumed two populations, A and B, are evenly distributed in a given geographic area the composition is 50/50. If they are not evenly distributed then one group is dominant within a given area.
Using LD as a measure of evenness Poole and Doherty found that 30 of Northern Irelands towns had LD measurements exceeding 50 and, because those towns were the majority of Northern Irelands urban settlements Northern Irelands larger towns were residentially segregated in 1981. The eleven towns with LD values below 50 represented only 9.1 percent of the total population in the 39 towns. Map 1.5 shows the LD indices of the 39 towns and Table 1.5 lists the indices (sorted by LD).
Map 1.5 Linear Dominance Indices of 39 Northern Ireland Towns (1981)
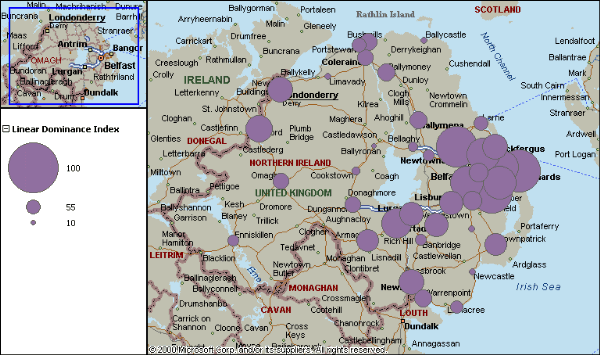
Table 1.5 Linear Dominance Indices of 39 Northern Ireland Towns (1981)
|
Town |
LINEAR DOMINANCE INDEX |
Town |
LINEAR DOMINANCE INDEX |
Town |
LINEAR DOMINANCE INDEX |
|
Donaghadee |
93.6 |
Armagh |
70.3 |
Antrim |
42.6 |
|
Comber |
93.3 |
Downpatrick |
69.9 |
Enniskillen |
42.5 |
|
Ballyclare |
92.4 |
Carryduff |
65.6 |
Randalstown |
39.2 |
|
Bangor |
85.7 |
Holywood |
64.9 |
Cookstown |
32.6 |
|
Carrickfergus |
85.0 |
Ballymoney |
61.8 |
Limavady |
29.1 |
|
Newtownards |
84.7 |
Ballymena |
61.0 |
Ballynahinch |
28.0 |
|
Belfast |
84.0 |
Portrush |
60.7 |
Ballycastle |
27.9 |
|
Portadown |
81.6 |
Warrenpoint |
59.7 |
Newcastle |
26.6 |
|
Strabane |
77.1 |
Omagh |
58.3 |
Magherafelt |
17.3 |
|
Whitehead |
74.4 |
Coleraine |
57.9 |
||
|
Derry |
74.3 |
Dungannon |
56.6 |
||
|
Newry |
73.9 |
Larne |
52.0 |
||
|
Dromore |
73.3 |
Portstewart |
51.8 |
||
|
Lurgan |
72.9 |
Kilkeel |
49.8 |
||
|
Lisburn |
71.3 |
Banbridge |
45.1 |
When the differing dimensions of segregation measurements are combined and analyzed using the high thresholds for each of the measures (dissimilarity = 60+; isolation = 70+; and, LD = 50+) five of Northern Irelands towns showed highly segregated patterns in 1981 (Table 1.6). Table 1.6 is sorted alphabetically by Town.
Table 1.6 Northern Ireland Towns Rating High on
Three Measures of Segregation Northern Ireland Towns
|
Town |
EVENNESS |
EXPOSURE |
EXPOSURE |
EVENNESS |
|
Armagh |
72.0 |
79.6 |
74.3 |
70.3 |
|
Belfast |
76.0 |
74.0 |
91.0 |
84.0 |
|
Derry |
70.9 |
86.8 |
66.8 |
74.3 |
|
Lurgan |
72.9 |
82.5 |
81.2 |
72.9 |
|
Portadown |
70.3 |
67.6 |
90.5 |
81.6 |
Based upon the comparative analysis shown in Table 1.6 (above) towns in Northern Ireland certainly appeared to have been every bit as residentially segregated in 1981, as were large metropolitan areas in the US Frostbelt in 1990. Similarly, although not analyzed within the scope of this paper, patterns of residential segregation in both the US Frostbelt region and in Northern Ireland towns have endured for decades. Poole and Doherty concluded in the Northern Ireland case that:
The province is an irregular mosaic of radically different placesnot just Catholic and Protestant, but with every conceivable level of mixing in between. All the pieces in the mosaic are tossed together into this single political unit, but the result is that nowhere is typical of Northern Ireland as a wholenot Belfast, not Ballymena, not Bushmills (262).
The same would certainly hold true for the US. No single place is typical of the whole US. In both Northern Ireland and the US however, patterns of residential segregation in certain areas are readily apparent to anyone traveling through them. Sadly, those patterns of residential segregation reflect the deep social divides within each society.
BIBLIOGRAPHY
Adversity.net, "Whites in Milwaukee rarely denied loans; theories on why abound" not dated, http://www.adversity.net/special/banking_housing_02.htm {external_link}
Center for Economic Development, University of Milwaukee-Wisconsin, The Economic State of Milwaukee: The City and the Region, {external_link} Levine, Marc V. with Callaghan, Sandra J., Milwaukee, Wisconsin, 1998
Massey, Douglas S. and Denton, Nancy A., "Hypersegregation in U.S. Metropolitan Areas: Black and Hispanic Segregation along Five Dimensions," Demography, Vol. 26, No. 3, August, 1989
Milwaukee Journal Sentinel, "Racial lending gap here still too wide -- but there's hope," April 11, 1999, http://www.jsonline.com/news/editorials/0411loans.asp {external_link}
Poole, Michael A. and Doherty, Paul, Ethnic Residential Segregation in Northern Ireland, Centre for the Study of Conflict, University of Ulster, Coleraine, Northern Ireland, 1996
US Census Bureau, Housing and Household Economic Statistics Division, http://www.census.gov/hhes/www/housing/resseg/gettable.html {external_link}
APPENDIX 1
Measures of Residential Segregation in 39 Northern Ireland Towns (1981)
|
Town |
EVENNESS |
EVENNESS |
EXPOSURE |
EXPOSURE |
EXPOSURE |
LINEAR DOMINANCE INDEX |
|
Antrim |
23.8 |
19.5 |
33.5 |
73.2 |
6.8 |
42.6 |
|
Armagh |
72.0 |
71.0 |
79.6 |
74.3 |
53.9 |
70.3 |
|
Ballycastle |
13.9 |
12.8 |
65.0 |
37.9 |
2.9 |
27.9 |
|
Ballyclare |
19.8 |
2.9 |
4.8 |
96.2 |
1.0 |
92.4 |
|
Ballymena |
38.2 |
25.2 |
33.1 |
82.4 |
15.6 |
61.0 |
|
Ballymoney |
19.9 |
12.3 |
23.7 |
82.0 |
5.7 |
61.8 |
|
Ballynahinch |
19.1 |
17.6 |
38.5 |
65.4 |
3.9 |
28.0 |
|
Banbridge |
22.2 |
17.7 |
31.4 |
74.1 |
5.5 |
45.1 |
|
Bangor |
26.7 |
7.1 |
10.9 |
93.2 |
4.0 |
85.7 |
|
Belfast |
76.0 |
59.0 |
74.0 |
91.0 |
65.0 |
84.0 |
|
Carrickfergus |
20.0 |
5.5 |
9.1 |
92.6 |
1.8 |
85.0 |
|
Carryduff |
21.9 |
12.5 |
20.2 |
83.4 |
3.6 |
65.6 |
|
Coleraine |
19.6 |
13.0 |
24.3 |
79.8 |
4.1 |
57.9 |
|
Comber |
13.5 |
1.7 |
3.8 |
96.7 |
0.4 |
93.3 |
|
Cookstown |
31.3 |
30.0 |
48.5 |
65.9 |
14.4 |
32.6 |
|
Derry |
70.9 |
57.6 |
86.8 |
66.8 |
53.6 |
74.3 |
|
Donaghadee |
23.2 |
2.9 |
4.0 |
96.8 |
0.8 |
93.6 |
|
Downpatrick |
46.6 |
26.0 |
86.8 |
34.2 |
20.9 |
69.9 |
|
Dromore |
20.0 |
9.3 |
15.5 |
87.0 |
2.5 |
73.3 |
|
Dungannon |
56.9 |
56.8 |
70.7 |
68.3 |
39 |
56.6 |
|
Enniskillen |
42.8 |
42.3 |
65.2 |
57.0 |
22.1 |
42.5 |
|
Holywood |
29.1 |
16.8 |
22.7 |
83.5 |
6.3 |
64.9 |
|
Kilkeel |
42.9 |
41.2 |
53.6 |
69.2 |
22.9 |
49.8 |
|
Larne |
22.8 |
16.7 |
29.1 |
77.3 |
6.5 |
52.0 |
|
Limavady |
22.3 |
21.0 |
42.2 |
64.6 |
6.7 |
29.1 |
|
Lisburn |
32.4 |
15.9 |
20.9 |
86.8 |
7.7 |
71.3 |
|
Lurgan |
72.9 |
72.8 |
82.5 |
81.2 |
63.8 |
72.9 |
|
Magherafelt |
11.7 |
11.5 |
44.2 |
58.1 |
2.3 |
17.3 |
|
Newcastle |
21.1 |
20.1 |
63.2 |
43.2 |
6.4 |
26.6 |
|
Newry |
51.3 |
25.2 |
88.7 |
32.6 |
21.3 |
73.9 |
|
Newtownards |
26.3 |
7.4 |
10.2 |
92.6 |
2.8 |
84.7 |
|
Omagh |
55.3 |
53.0 |
75.7 |
63.2 |
38.9 |
58.3 |
|
Portadown |
70.3 |
49.3 |
67.6 |
90.5 |
58.1 |
81.6 |
|
Portrush |
21.9 |
13.9 |
23.5 |
81.3 |
4.7 |
60.7 |
|
Portstewart |
8.60 |
6.3 |
24.9 |
76.1 |
1.0 |
51.8 |
|
Randalstown |
24.4 |
22.6 |
44.2 |
67.9 |
12.1 |
39.2 |
|
Strabane |
43.2 |
17.5 |
89.7 |
20.6 |
10.3 |
77.1 |
|
Warrenpoint |
16.4 |
10.5 |
80.3 |
21.8 |
2.1 |
59.7 |
|
Whitehead |
16.7 |
7.5 |
14.4 |
87.4 |
1.8 |
74.4 |
CAIN
contains information and source material on the conflict
and politics in Northern Ireland. CAIN is based within Ulster University. |
|
|||
|
Last modified :
|
||
|
| ||