
Assembly Election (NI) Wednesday 7 March 2007[Key_Events] [KEY_ISSUES] [Conflict_Background] POLITICS: [Menu] [Reading] [Articles] [Government] [Political_Initiatives] [Political_Solutions] [Parties] [ELECTIONS] [Polls] [Sources] [Peace_Process] Material is added to this site on a regular basis - information on this page may change Assembly Election (NI)
|
|
|

|

|
|

|
|
|

|
|
This page contains the results of the 7 March 2007 Northern Ireland Assembly Election.
See also:
- List of Candidates
- Number of Candidates Standing for Each Political Party
- Number of candidates in each constituency
- Electoral Office for Northern Ireland (EONI). (2007). Number of electorate by ward in each constituency, 1 February 2007, [PDF File; 60KB]. Belfast: EONI.
Introduction
The following provides the results from the 18 Northern Ireland constituencies where the 2007 Northern Ireland Assembly Election was contested. Voting in the election was by Proportional Representation (PR) using the Single Transferable Vote (STV) system.
Summary of Results for Northern Ireland
Electorate: 1,097,526Valid votes cast: 692,028
Percentage poll: 63.05%
| Party |
No. 1st Preference Votes |
% Votes |
Change % Votes |
No. Seats |
Change No. Seats |
|
Democratic Unionist Party (DUP) |
177944 |
25.71 |
+7.70 |
30 |
+10 |
|
Sinn Féin (SF) |
162758 |
23.52 |
+5.89 |
24 |
+6 |
|
Ulster Unionist Party (UUP) |
156931 |
22.68 |
+1.43 |
27 |
+1 |
|
Social Democratic and Labour Party (SDLP) |
117547 |
16.99 |
-4.97 |
18 |
-5 |
|
Alliance Party of Northern Ireland (APNI) |
25370 |
3.67 |
-2.83 |
6 |
0 |
|
Independent (Ind) |
19256 |
2.78 |
- |
1 |
0 |
|
Progressive Unionist Party (PUP) |
8032 |
1.16 |
-1.39 |
1 |
-1 |
|
Northern Ireland Women's Coalition (NIWC) |
5785 |
0.84 |
-0.77 |
0 |
-2 |
|
United Kingdom Unionists (UKUP) |
5700 |
0.82 |
-3.69 |
1 |
0 |
| Independent Unionist (Ind U) | |||||
| United Unionist Coalition (UUC) | |||||
|
Green Party (Green) |
2688 |
0.39 |
+0.30 |
0 |
0 |
|
Socialist Environmental Alliance (SEA) |
2394 |
0.35 |
- |
0 |
0 |
|
Conservative Party (Con) |
1604 |
0.23 |
+0.03 |
0 |
0 |
|
Workers' Party (WP) |
1407 |
0.20 |
-0.04 |
0 |
0 |
|
Northern Ireland Unionist Party (NIUP) |
1350 |
0.20 |
- |
0 |
-4 |
| Independent Nationalist (Ind N) | |||||
|
Socialist Party (SP) |
343 |
0.05 |
- |
0 |
0 |
| Independent Labour (Ind L) | |||||
|
Vote For Yourself Party (VFYP) |
124 |
0.02 |
- |
0 |
0 |
|
Ulster Third Way (UTW) |
16 |
0.00 |
0 |
0 |
|
|
Total |
692026 |
100.00 |
108 |
Detailed Constituency Results
The results for each of the 18 constituencies contain the following information:
Name of constituency
Size of Electorate; Quota; Valid Votes; and Valid Percentage Turnout
Outcome of vote
Name of candidate (Party); Number of first preference votes; and the count on which the candidate was elected.
| East Antrim | |||
| Electorate |
55,473 |
||
| Quota |
4,423 |
||
| Valid Votes |
30,952 |
||
| Valid Percentage Turnout |
55.80 |
||
| Candidate (Party) |
No. 1st Preference Votes |
% of Votes |
Elected on Count |
| Roy Beggs (UUP) |
5175 |
16.72 |
1st count |
| Sammy Wilson (DUP) |
4544 |
14.68 |
1st count |
| George Dawson (DUP) |
3163 |
10.22 |
15th count |
| David Hilditch (DUP) |
2856 |
9.23 |
15th count |
| Daniel O'Connor (SDLP) |
2428 |
7.84 |
|
| Sean Neeson (APNI) |
2180 |
7.04 |
15th count |
| Ken Robinson (UUP) |
2062 |
6.66 |
15th count |
| Roy McCune (UUP) |
1646 |
5.32 |
|
| Jack McKee (Ind) |
1449 |
4.68 |
|
| Stewart Dickson (APNI) |
1192 |
3.85 |
|
| Roger Hutchinson (Ind U) |
1011 |
3.27 |
|
| Oliver McMullan (SF) |
768 |
2.48 |
|
| Tom Robinson (UKUP) |
564 |
1.82 |
|
| Carolyn Howarth (PUP) |
534 |
1.73 |
|
| Robert Lindsay Mason (Ind) |
364 |
1.18 |
|
| John Hugh Anderson (Ind) |
348 |
1.12 |
|
| Anne Monaghan (NIWC) |
307 |
0.99 |
|
| Alan Greer (Con) |
196 |
0.63 |
|
| Andrew Robert Frew (Green) |
165 |
0.53 |
|
| Total |
30952 |
100.00 |
| North Antrim | |||
| Electorate |
70,489 |
||
| Quota |
6,301 |
||
| Valid Votes |
44,097 |
||
| Valid Percentage Turnout |
62.56 |
||
| Candidate (Party) |
No. 1st Preference Votes |
% of Votes |
Elected on Count |
| Ian Paisley (DUP) |
8732 |
19.80 |
1st count |
| Ian Paisley (Junior) (DUP) |
7898 |
17.91 |
1st count |
| Robert Coulter (UUP) |
6385 |
14.48 |
1st count |
| Philip McGuigan (SF) |
6195 |
14.05 |
9th count |
| Sean Farren (SDLP) |
3648 |
8.27 |
9th count |
| Mervyn Storey (DUP) |
3605 |
8.18 |
3rd count |
| James Currie (UUP) |
3153 |
7.15 |
|
| Declan O'Loan (SDLP) |
2361 |
5.35 |
|
| Jayne Dunlop (APNI) |
865 |
1.96 |
|
| Gardiner Kane (Ind U) |
623 |
1.41 |
|
| Nathaniel Small (UKUP) |
402 |
0.91 |
|
| Billy McCaughey (PUP) |
230 |
0.52 |
|
| Total |
44097 |
100.00 |
| South Antrim | |||
| Electorate |
63,640 |
||
| Quota |
5,347 |
||
| Valid Votes |
37,421 |
||
| Valid Percentage Turnout |
58.80 |
||
| Candidate (Party) |
No. 1st Preference Votes |
% of Votes |
Elected on Count |
| David Burnside (UUP) |
7066 |
18.88 |
1st count |
| Wilson Clyde (DUP) |
5131 |
13.71 |
5th count |
| Paul Girvan (DUP) |
4820 |
12.88 |
6th count |
| Martin Meehan (SF) |
4295 |
11.48 |
|
| David Ford (APNI) |
3393 |
9.07 |
11th count |
| Jim Wilson (UUP) |
3135 |
8.38 |
9th count |
| Thomas Burns (SDLP) |
2732 |
7.30 |
11th count |
| Donovan McClelland (SDLP) |
2671 |
7.14 |
|
| John Smyth (DUP) |
1501 |
4.01 |
|
| Adrian Cochrane Watson (UUP) |
953 |
2.55 |
|
| Norman Boyd (NIUP) |
774 |
2.07 |
|
| Joan Cosgrove (NIWC) |
465 |
1.24 |
|
| Kenneth Wilkinson (PUP) |
311 |
0.83 |
|
| Jason Docherty (Con) |
174 |
0.46 |
|
| Total |
37,421 |
100.00 |
| Belfast East | |||
| Electorate |
51,937 |
||
| Quota |
4,425 |
||
| Valid Votes |
30,965 |
||
| Valid Percentage Turnout |
59.62 |
||
| Candidate (Party) |
No. 1st Preference Votes |
% of Votes |
Elected on Count |
| Peter Robinson (DUP) |
9254 |
29.89 |
1st count |
| Reg Empey (UUP) |
6459 |
20.86 |
1st count |
| David Ervine (PUP) |
2990 |
9.66 |
6th count |
| Naomi Long (APNI) |
2774 |
8.96 |
6th count |
| Michael Copeland (UUP) |
2291 |
7.40 |
6th count |
| Jim Rodgers (UUP) |
1502 |
4.85 |
|
| Robin Newton (DUP) |
1475 |
4.76 |
3rd count |
| Harry Toan (DUP) |
1403 |
4.53 |
|
| Joseph O'Donnell (SF) |
1180 |
3.81 |
|
| Leo Van Es (SDLP) |
967 |
3.12 |
|
| Terence Dick (Con) |
232 |
0.75 |
|
| Thomas Black (SP) |
176 |
0.57 |
|
| Joseph Bell (WP) |
125 |
0.40 |
|
| John McBlain (Ind) |
72 |
0.23 |
|
| George Weiss (VFYP) |
65 |
0.21 |
|
| Total |
30965 |
100.00 |
| Belfast North | |||
| Electorate |
51,353 |
||
| Quota |
4,506 |
||
| Valid Votes |
31,532 |
||
| Valid Percentage Turnout |
61.40 |
||
| Candidate (Party) |
No. 1st Preference Votes |
% of Votes |
Elected on Count |
| Nigel Dodds (DUP) |
9276 |
29.42 |
1st count |
| Gerry Kelly (SF) |
5524 |
17.52 |
1st count |
| Alban Maginness (SDLP) |
3186 |
10.10 |
12th count |
| Cathy Stanton (SF) |
2990 |
9.48 |
12th count |
| Fred Cobain (UUP) |
2961 |
9.39 |
10th count |
| Pat Convery (SDLP) |
2108 |
6.69 |
|
| Nelson McCausland (DUP) |
1500 |
4.76 |
2nd count |
| Billy Hutchinson (PUP) |
1358 |
4.31 |
|
| Fraser Agnew (UUC) |
802 |
2.54 |
|
| Frank McCoubrey (Ind U) |
469 |
1.49 |
|
| Eliz Byrne McCullough (NIWC) |
467 |
1.48 |
|
| Majorie Hawkins (APNI) |
305 |
0.97 |
|
| Peter Emerson (Green) |
261 |
0.83 |
|
| Raymond McCord (Ind U) |
218 |
0.69 |
|
| Marcella Delaney (WP) |
90 |
0.29 |
|
| John Leo Gallagher (VFYP) |
17 |
0.05 |
|
| Total |
31532 |
100.00 |
| Belfast South | |||
| Electorate |
50,707 |
||
| Quota |
4,477 |
||
| Valid Votes |
31,330 |
||
| Valid Percentage Turnout |
61.79 |
||
| Candidate (Party) |
No. 1st Preference Votes |
% of Votes |
Elected on Count |
| Michael McGimpsey (UUP) |
5389 |
17.20 |
1st count |
| Mark Robinson (DUP) |
3991 |
12.74 |
11th count |
| Alex Maskey (SF) |
3933 |
12.55 |
12th count |
| Carmel Hanna (SDLP) |
3910 |
12.48 |
12th count |
| Alasdair McDonnell (SDLP) |
3266 |
10.42 |
12th count |
| Ruth Patterson (DUP) |
2538 |
8.10 |
|
| Esmond Birnie (UUP) |
2311 |
7.38 |
11th count |
| Monica McWilliams (NIWC) |
2150 |
6.86 |
|
| Geraldine Rice (APNI) |
1185 |
3.78 |
|
| John Hiddleston (UUP) |
769 |
2.45 |
|
| Tom Ekin (APNI) |
664 |
2.12 |
|
| Thomas Morrow (PUP) |
495 |
1.58 |
|
| John Wright (Green) |
308 |
0.98 |
|
| James Barbour (SP) |
167 |
0.53 |
|
| Roger Lomas (Con) |
116 |
0.37 |
|
| Patrick Lynn (WP) |
96 |
0.31 |
|
| Lindsay Steven (VFYP) |
42 |
0.13 |
|
| Total |
31330 |
100.00 |
| Belfast West | |||
| Electorate |
50,861 |
||
| Quota |
4,694 |
||
| Valid Votes |
32,854 |
||
| Valid Percentage Turnout |
64.60 |
||
| Candidate (Party) |
No. 1st Preference Votes |
% of Votes |
Elected on Count |
| Gerry Adams (SF) |
6199 |
18.87 |
1st count |
| Fra McCann (SF) |
4263 |
12.98 |
6th count |
| Bairbre de Brun (SF) |
4069 |
12.39 |
6th count |
| Michael Ferguson (SF) |
3849 |
11.72 |
8th count |
| Alex Attwood (SDLP) |
3667 |
11.16 |
5th count |
| Sue Ramsey (SF) |
2988 |
9.09 |
|
| Joe Hendron (SDLP) |
2583 |
7.86 |
|
| Diane Dodds (DUP) |
2544 |
7.74 |
8th count |
| Chris McGimpsey (UUP) |
1170 |
3.56 |
|
| Hugh Smyth (PUP) |
813 |
2.47 |
|
| John Lowry (WP) |
407 |
1.24 |
|
| John Leslie MacVicar (Ind U) |
211 |
0.64 |
|
| Kathryn Ayers (APNI) |
75 |
0.23 |
|
| David Thomas Kerr (UTW) |
16 |
0.05 |
|
| Total |
32854 |
100.00 |
| North Down | |||
| Electorate |
57,422 |
||
| Quota |
4,406 |
||
| Valid Votes |
30,835 |
||
| Valid Percentage Turnout |
53.70 |
||
| Candidate (Party) |
No. 1st Preference Votes |
% of Votes |
Elected on Count |
| Leslie Cree (UUP) |
3900 |
12.65 |
12th count |
| Peter Weir (DUP) |
3675 |
11.92 |
14th count |
| Alex Easton (DUP) |
3570 |
11.58 |
14th count |
| Alan McFarland (UUP) |
3421 |
11.09 |
14th count |
| Robert McCartney (UKUP) |
3374 |
10.94 |
14th count |
| Diana Peacocke (UUP) |
2566 |
8.32 |
|
| Eileen Bell (APNI) |
1951 |
6.33 |
13th count |
| Liam Logan (SDLP) |
1519 |
4.93 |
|
| Brian Wilson (Ind) |
1350 |
4.38 |
|
| Jane Morrice (NIWC) |
1181 |
3.83 |
|
| Alan Chambers (Ind) |
1077 |
3.49 |
|
| John Barry (Green) |
730 |
2.37 |
|
| Stephen Farry (APNI) |
704 |
2.28 |
|
| Julian Robertson (Con) |
491 |
1.59 |
|
| Alan Sydney Field (Ind) |
428 |
1.39 |
|
| David Rose (PUP) |
316 |
1.02 |
|
| Maria George (SF) |
264 |
0.86 |
|
| Tom Sheridan (UKUP) |
209 |
0.68 |
|
| Christopher Carter (Ind) |
109 |
0.35 |
|
| Total |
30835 |
100.00 |
| South Down | |||
| Electorate |
70,149 |
||
| Quota |
6,479 |
||
| Valid Votes |
45,346 |
||
| Valid Percentage Turnout |
64.64 |
||
| Candidate (Party) |
No. 1st Preference Votes |
% of Votes |
Elected on Count |
| Jim Wells (DUP) |
6789 |
14.97 |
1st count |
| Dermot Nesbitt (UUP) |
5368 |
11.84 |
8th count |
| PJ Bradley (SDLP) |
5337 |
11.77 |
4th count |
| Caitriona Ruane (SF) |
5118 |
11.29 |
9th count |
| Margaret Ritchie (SDLP) |
4261 |
9.40 |
9th count |
| Willie Clark (SF) |
4083 |
9.00 |
9th count |
| Eamonn O'Neill (SDLP) |
3942 |
8.69 |
|
| Jim Donaldson (UUP) |
2885 |
6.36 |
|
| Eamonn McConvey (SF) |
2806 |
6.19 |
|
| Marian Fitzpatrick (SDLP) |
2382 |
5.25 |
|
| Raymond Blaney (Green) |
799 |
1.76 |
|
| Trudy Miller (NIWC) |
565 |
1.25 |
|
| Neil Powell (APNI) |
489 |
1.08 |
|
| Nelson Wharton (UKUP) |
245 |
0.54 |
|
| Malachi Curran (Ind Lab) |
162 |
0.36 |
|
| Desmond O'Hagan (WP) |
115 |
0.25 |
|
| Total |
45346 |
100.00 |
| Fermanagh and South Tyrone | |||
| Electorate |
64,336 |
||
| Quota |
6,595 |
||
| Valid Votes |
46,160 |
||
| Valid Percentage Turnout |
71.75 |
||
| Candidate (Party) |
No. 1st Preference Votes |
% of Votes |
Elected on Count |
| Michelle Gildernew (SF) |
6489 |
14.06 |
5th count |
| Tom Elliot (UUP) |
6181 |
13.39 |
3rd count |
| Maurice Morrow (DUP) |
5536 |
11.99 |
6th count |
| Tom O'Reilly (SF) |
5019 |
10.87 |
8th count |
| Arlene Foster (UUP) |
4938 |
10.70 |
5th count |
| Tommy Gallagher (SDLP) |
4735 |
10.26 |
5th count |
| Gerry McHugh (SF) |
4393 |
9.52 |
|
| Bert Johnston (DUP) |
3094 |
6.70 |
|
| Frank Britton (SDLP) |
2772 |
6.01 |
|
| Robert Mulligan (UUP) |
2110 |
4.57 |
|
| Eithne McNulty (NIWC) |
650 |
1.41 |
|
| Linda Cleland (APNI) |
243 |
0.53 |
|
| Total |
46160 |
100.00 |
| Foyle | |||
| Electorate |
65,303 |
||
| Quota |
5,830 |
||
| Valid Votes |
40,806 |
||
| Valid Percentage Turnout |
62.49 |
||
| Candidate (Party) |
No. 1st Preference Votes |
% of Votes |
Elected on Count |
| Mark Durkan (SDLP) |
6806 |
16.68 |
1st count |
| William Hay (DUP) |
6101 |
14.95 |
1st count |
| Mitchel McLaughlin (SF) |
6036 |
14.79 |
1st count |
| Raymond McCartney (SF) |
3679 |
9.02 |
|
| Mary Nelis (SF) |
3499 |
8.57 |
9th count |
| Mary Bradley (SDLP) |
3345 |
8.20 |
8th count |
| Mary Hamilton (UUP) |
3322 |
8.14 |
|
| Pat Ramsey (SDLP) |
2826 |
6.93 |
9th count |
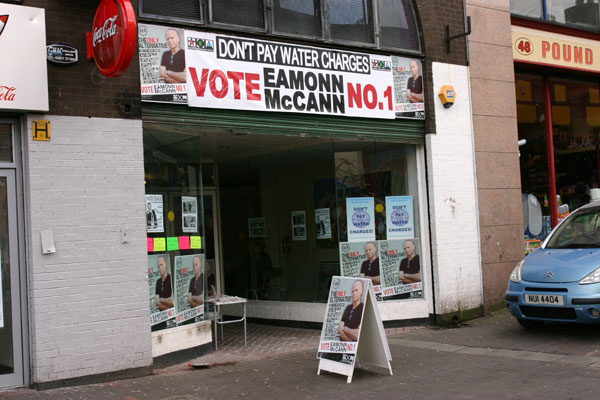
| Eamonn McCann (SEA) |
2257 |
5.53 |
|
| Gerard Diver (SDLP) |
1769 |
4.34 |
|
| Annie Courtney (Ind N) |
802 |
1.97 |
|
| Alan Castle (APNI) |
227 |
0.56 |
|
| Danny McBrearty (Ind) |
137 |
0.34 |
|
| Total |
40806 |
100.00 |
| Lagan Valley | |||
| Electorate |
67,910 |
||
| Quota |
5,894 |
||
| Valid Votes |
41,254 |
||
| Valid Percentage Turnout |
60.75 |
||
| Candidate (Party) |
No. 1st Preference Votes |
% of Votes |
Elected on Count |
| Jeffrey Donaldson (UUP) |
14104 |
34.19 |
1st count |
| Edwin Poots (DUP) |
5175 |
12.54 |
2nd count |
| Seamus Close (APNI) |
4408 |
10.69 |
7th count |
| Andrew Hunter (DUP) |
3300 |
8.00 |
|
| Paul Butler (SF) |
3242 |
7.86 |
|
| Patricia Lewsley (SDLP) |
3133 |
7.59 |
9th count |
| Billy Bell (UUP) |
2782 |
6.74 |
6th count |
| Ivan Davis (Ind U) |
2223 |
5.39 |
|
| Norah Beare (UUP) |
1508 |
3.66 |
10th count |
| Jim Kirkpatrick (UUP) |
675 |
1.64 |
|
| Joanne Johnston (Con) |
395 |
0.96 |
|
| Andrew Park (PUP) |
212 |
0.51 |
|
| Frances McCarthy (WP) |
97 |
0.24 |
|
| Total |
41254 |
100.00 |
| East Londonderry | |||
| Electorate |
56,203 |
||
| Quota |
4,897 |
||
| Valid Votes |
34,273 |
||
| Valid Percentage Turnout |
60.98 |
||
| Candidate (Party) |
No. 1st Preference Votes |
% of Votes |
Elected on Count |
| Gregory Campbell (DUP) |
4789 |
13.97 |
3rd count |
| David McClarty (UUP) |
4069 |
11.87 |
4th count |
| Francis Brolly (SF) |
4019 |
11.73 |
7th count |
| George Robinson (DUP) |
3466 |
10.11 |
10th count |
| John Dallat (SDLP) |
3190 |
9.31 |
12th count |
| Maurice Bradley (DUP) |
2836 |
8.27 |
|
| Michael Coyle (SDLP) |
2394 |
6.99 |
|
| Norman Hillis (UUP) |
2292 |
6.69 |
11th count |
| Cliona O'Kane (SF) |
2102 |
6.13 |
|
| Boyd Douglas (UUC) |
1903 |
5.55 |
|
| Edwin Stevenson (UUP) |
1408 |
4.11 |
|
| Pauline Armitage (UKUP) |
906 |
2.64 |
|
| Yvonne Boyle (APNI) |
762 |
2.22 |
|
| Marion Baur (SEA) |
137 |
0.40 |
|
| Total |
34273 |
100.00 |
| Newry and Armagh | |||
| Electorate |
68,731 |
||
| Quota |
6,769 |
||
| Valid Votes |
47,378 |
||
| Valid Percentage Turnout |
68.93 |
||
| Candidate (Party) |
No. 1st Preference Votes |
% of Votes |
Elected on Count |
| Paul Berry (DUP) |
8125 |
17.15 |
1st count |
| Conor Murphy (SF) |
7595 |
16.03 |
1st count |
| Danny Kennedy (UUP) |
7347 |
15.51 |
1st count |
| Davy Hyland (SF) |
5779 |
12.20 |
5th count |
| Pat O'Rawe (SF) |
5478 |
11.56 |
5th count |
| Jim Lennon (SDLP) |
4116 |
8.69 |
|
| Dominic Bradley (SDLP) |
4111 |
8.68 |
5th count |
| John Fee (SDLP) |
3410 |
7.20 |
|
| William Frazer (Ind U) |
632 |
1.33 |
|
| Freda Donnelly (DUP) |
474 |
1.00 |
|
| Peter Whitcroft (APNI) |
311 |
0.66 |
|
| Total |
47378 |
100.00 |
| Strangford | |||
| Electorate |
66,308 |
||
| Quota |
5,322 |
||
| Valid Votes |
37,250 |
||
| Valid Percentage Turnout |
56.18 |
||
| Candidate (Party) |
No. 1st Preference Votes |
% of Votes |
Elected on Count |
| Iris Robinson (DUP) |
8548 |
22.95 |
1st count |
| Lord Kilclooney (UUP) |
5658 |
15.19 |
1st count |
| Jim Shannon (DUP) |
4703 |
12.63 |
2nd count |
| George Ennis (DUP) |
4606 |
12.37 |
2nd count |
| David McNarry (UUP) |
3000 |
8.05 |
10th count |
| Joe Boyle (SDLP) |
2906 |
7.80 |
|
| Kieran McCarthy (APNI) |
2741 |
7.36 |
11th count |
| Bob Little (UUP) |
2123 |
5.70 |
|
| Dermot Kennedy (SF) |
1105 |
2.97 |
|
| Cedric Wilson (NIUP) |
576 |
1.55 |
|
| Colin Neill (PUP) |
540 |
1.45 |
|
| Philip Orr (Green) |
425 |
1.14 |
|
| Danny McCarthy (Ind N) |
319 |
0.86 |
|
| Total |
37250 |
100.00 |
| West Tyrone | |||
| Electorate |
57,795 |
||
| Quota |
5,962 |
||
| Valid Votes |
41,729 |
||
| Valid Percentage Turnout |
72.20 |
||
| Candidate (Party) |
No. 1st Preference Votes |
% of Votes |
Elected on Count |
| Kieran Deeny (Ind) |
6158 |
14.76 |
1st count |
| Pat Doherty (SF) |
6019 |
14.42 |
1st count |
| Barry McElduff (SF) |
5642 |
13.52 |
8th count |
| Thomas Buchanan (DUP) |
4739 |
11.36 |
5th count |
| Brian McMahon (SF) |
4450 |
10.66 |
|
| Derek Hussey (UUP) |
3733 |
8.95 |
6th count |
| Eugene McMenamin (SDLP) |
3465 |
8.30 |
8th count |
| Joe Byrne (SDLP) |
2645 |
6.34 |
|
| Derek Reaney (DUP) |
2547 |
6.10 |
|
| Bert Wilson (UUP) |
1934 |
4.63 |
|
| Roy Reid (PUP) |
233 |
0.56 |
|
| Steven Alexander (APNI) |
164 |
0.39 |
|
| Total |
41729 |
100.00 |
| Mid Ulster | |||
| Electorate |
60,095 |
||
| Quota |
6,338 |
||
| Valid Votes |
44,362 |
||
| Valid Percentage Turnout |
73.82 |
||
| Candidate (Party) |
No. 1st Preference Votes |
% of Votes |
Elected on Count |
| William McCrea (DUP) |
8211 |
18.51 |
1st count |
| Martin McGuinness (SF) |
8128 |
18.32 |
1st count |
| Geraldine Dougan (SF) |
5827 |
13.14 |
4th count |
| Francis Molloy (SF) |
5255 |
11.85 |
3rd count |
| Billy Armstrong (UUP) |
4323 |
9.74 |
7th count |
| Patsy McGlone (SDLP) |
4295 |
9.68 |
8th count |
| Denis Haughey (SDLP) |
3843 |
8.66 |
|
| Trevor Wilson (UUP) |
2071 |
4.67 |
|
| Alan Millar (DUP) |
1029 |
2.32 |
|
| Cora Groogan (SF) |
984 |
2.22 |
|
| Francis Donnelly (WP) |
230 |
0.52 |
|
| James Holmes (APNI) |
166 |
0.37 |
|
| Total |
44362 |
100.00 |
| Upper Bann | |||
| Electorate |
68,814 |
||
| Quota |
6,213 |
||
| Valid Votes |
43,482 |
||
| Valid Percentage Turnout |
63.19 |
||
| Candidate (Party) |
No. 1st Preference Votes |
% of Votes |
Elected on Count |
| David Trimble (UUP) |
9158 |
21.06 |
1st count |
| David Simpson (DUP) |
5933 |
13.64 |
5th count |
| John O'Dowd (SF) |
5524 |
12.70 |
11th count |
| Stephen Moutray (DUP) |
4697 |
10.80 |
6th count |
| Dara O'Hagan (SF) |
3970 |
9.13 |
|
| Dolores Kelly (SDLP) |
3661 |
8.42 |
11th count |
| Kieran Corr (SDLP) |
3157 |
7.26 |
|
| Samuel Gardiner (UUP) |
2359 |
5.43 |
9th count |
| Denis Watson (DUP) |
1770 |
4.07 |
|
| George Savage (UUP) |
1269 |
2.92 |
|
| David Jones (Ind) |
585 |
1.35 |
|
| Sidney Anderson (Ind) |
581 |
1.34 |
|
| Francis McQuaid (APNI) |
571 |
1.31 |
|
| Thomas French (WP) |
247 |
0.57 |
|
| Total |
43482 |
100.00 |
Source: Various media reports
CAIN
contains information and source material on the conflict
and politics in Northern Ireland. CAIN is based within Ulster University. |
|
|||
|
Last modified :
|
||
|
| ||