Majority Minority Review 3: Housing and Religion in Northern Ireland, by Martin Melaugh[Key_Events] Key_Issues] [Conflict_Background] Material is added to this site on a regular basis - information on this page may change
Housing and Religion in Northern Ireland
Section 5: The 1981 Census
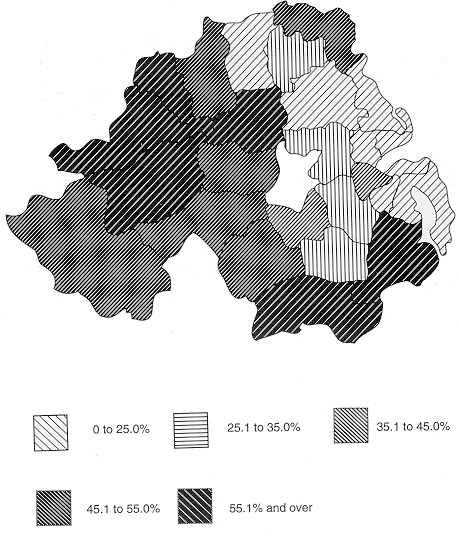
At the time of the 1981 Census the NIHE had been in existence for almost l0 years. During this period the Housing Executive had begun to make a positive impact on the poor housing conditions that had been recorded in its first House Condition Survey (HCS) in 1974 (NIHE, 1974). The 1981 Census therefore gives an opportunity to examine the impact that housing policy was having on the circumstances of Catholic and Protestant households. Although no county reports were published the 1981 Census did include, in its Religion Report (Registrar General Northern Ireland 1984), information similar to that published in 1971. This can be used as a basis for an examination of changes over the 10 year period. The Religion Report also contained a table of particular interest that gave a breakdown of religion by amenity provision for the 26 district councils areas (this detail was not provided in the 1971 published report).
This section will look at the information contained in the Religion
Report at a Northern Ireland level and also consider some of the
inferences that may be drawn at a district council area level.
These are based on associations between the available data and
the proportion of Catholics living in each area; estimates of
the number of Catholics in each area are derived from Compton
and Power (1986): see Figure 5.1. Some of the changes between
the dates of the two censuses will also be highlighted. Appendixes
5.1 and 5.2 contain the data, extracted from the Census reports,
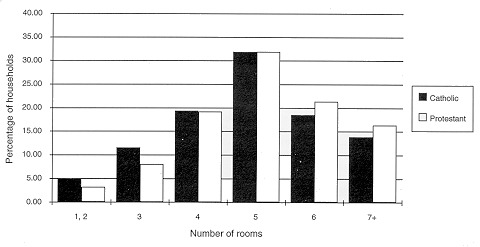
used in this Section. The differences in tenure of occupation between Catholics and Protestants reported in the 1981 Census were broadly similar to figures for 1971. The biggest single change for both communities was the steep decline in the private rented sector, but the relative position within this sector was roughly similar with fewer Catholic households (6.3%; down from 16.1% in 1971) being private renters compared with Protestant households (10.4%; 20.5% in 1971). The other main changes were an increase in the size of the public rented sector with the biggest increase being among Catholic households (Catholic households 47.7% up from 40.9%, Protestant households 36.8% up from 32.2%), and also an increase in the owner-occupied sector, more so amongst Protestant households (Catholic 44.7% up from 42.3%, Protestant 51.6% up from 47.8% in 1971). While it is evident that there was a decline in the average household size between 1971 and 1981 for both Catholics and Protestants, Catholic households remained larger at 3.76 persons compared with 2.92 for Protestant households. This difference in average household size continued to be reflected in the average number of persons per occupied room, with Catholic households living in more overcrowded conditions at 0.75 persons per room compared to Protestant households at 0.56 persons per room. This difference was greatest at the higher levels of density with over three times as many Catholic households (19.6%) living at a density of over one person per room than Protestant households (6.0%). An examination of public sector tenants shows that Catholic households were much more likely to be living at densities of one or more person per room than Protestant households (23.7% and 9.8% respectively). Data on the distribution of dwelling size showed a general reduction in the percentage of households living in smaller properties and an increase in those living in houses with five or more rooms. In addition to this improvement there was also a reduction in the discrepancy in dwelling size between Catholic and Protestant households during the ten years since the 1971 Census: see Figure 5.2 (a comparison with Figure 3.2 shows the obvious changes). It should be noted that Catholic households remained more likely to occupy smaller dwellings and less likely to occupy larger ones.
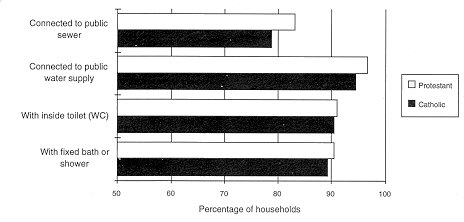
There were some slight differences between the 1971 and 1981 Censuses on the type of information collected on amenities and service provision in dwellings. There is, however, sufficient data in the various reports to make a comparison of trends over the ten years between the two communities[1]. The published reports of the Census do not provide the level of detail to be able to examine a number of variables simultaneously. For example it would be interesting to see tables of amenity provision broken down by religion by tenure and by area. This type of information would make it possible to consider only those households in public rented accommodation and to make an assessment of the housing characteristics of Catholic and Protestants in the public sector. The items for which information was collected in both the 1971 and 1981 Censuses were exclusive use of fixed bath or shower and the exclusive use of an inside flush toilet. A comparison of the data showed that there were large increases in the provision of these amenities and also substantial decreases in the differences between the two communities: see Figure 5.3 (compare with the similar items in Figure 3.3). This information includes all tenures however, given that the public rented sector accounted for 40.9 per cent of total households in 1971 and 47.7 per cent in 1981, it would be reasonable to assume that the improvement in amenity levels was reflected in that housing sector.
During the time this improvement was being secured the Housing Executive was applying the criterion of need to decisions on its housing programme. It could be argued, therefore, that the information on the substantial improvement in the relative position of Catholic households provides circumstantial evidence that objective measures of need were not being applied to considerable number of households in the period up to 1971. In the owner-occupied sector and the private rented sector it could be claimed that Catholic households chose to live in dwellings with fewer amenities. A more credible explanation might be that they could not afford to purchase or rent the accommodation in better condition. The economic differences between Catholics and Protestant households, particularly with regard to employment and income, may have been the determining factors in the differentials in most housing characteristics.
Two items which were not reported in 1971 concerned the provision
of services to the dwelling, namely connection to the public water
supply and connection to the public sewer: see Figure 5.3. In
both cases the 1981 Census showed slight differences between the
rates for Catholic and Protestant households. 94.6 per cent of
Catholic households were connected to the public mains water supply
compared to 96.8 per cent of Protestant households. For connection
to the public sewer the figures were 78.9 per cent for Catholics
households and 83.3 per cent for Protestant households. These
differences reflect the urban/rural split in the population with
significant numbers of Catholics living in the more remote rural
west of the region. While it might be thought reasonable to place
a target of almost 1 00 per cent on internal housing amenities,
the element of choice and the practical problems in servicing
especially remote or difficult terrain makes it likely that there
will always be a small percentage of dwellings that depend on
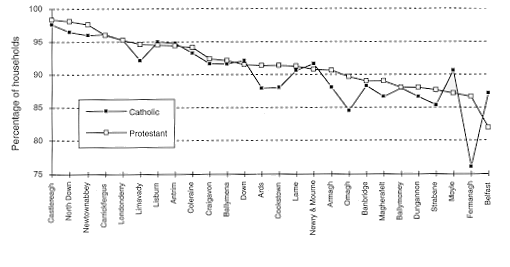
private services and sewerage. Differences in overcrowding between Catholic and Protestant households mentioned above, were confirmed by strong correlations between the percentage of Catholic households in each district council area and both the average number of persons per room and the percentage of households living at a density of more than 1.0 persons per room. The Religion Report of the 1981 Census contained a district council breakdown of the religion and amenities table. While this was breakdown was unavailable in the 1971 published report, the data in Section Three provided by Dr Power can be used for direct comparison. This type of breakdown has the advantage of allowing consideration of differences at a lower level of aggregation. From the 1981 data it is possible to look at figures for the amenities of fixed bath and flush toilet, and for the services of public water supply and public sewer, available to Catholic and Protestant households in each district council area. The general pattern for each housing characteristic is the same and can be illustrated by that for the exclusive use of a fixed bath or shower as shown in Figure 5.4. The district council areas have been ranked from the Protestant council area with the most provision to the Protestant council area with the least. The information confirms the Northern Ireland summary figure: in most councils Catholics have a lower level of provision. In two areas, Moyle and Belfast, the position is reversed. As with the results in Section Three (see Figure 3.6) the most striking aspect of the graph is the difference between the council areas with the highest and lowest levels of provision. This difference is greater than that between the religions. On the whole the urban eastern and northern councils tend to have the best provision as opposed to the western and southern areas. Other variables that undoubtedly affected the distribution, and which cannot be accounted for, are the number of rural households and the breakdown of tenure in each area. A comparison between the 1971 and 1981 data shows clear improvements in the level of amenities in each area and also a narrowing of the gap in provision as between Catholic and Protestant households. This is clear from Figure 5.4 and also the diagram in Appendix 3.3 which both show the position for the provision of a fixed bath or shower. As the provision of individual amenities tends to be correlated, and as there is also a high association between the absence of amenities and the level of unfitness, this information gives some clues as to the physical condition of dwellings in each of the periods. It is probable that there was a higher rate of unfitness among Catholic dwellings in 1971 and this position had improved considerably by 1981.
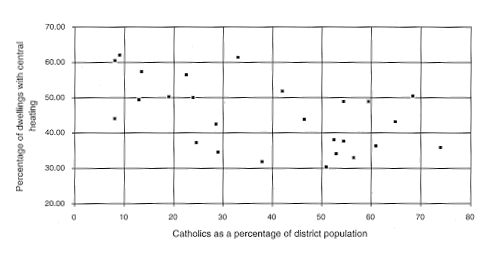
A similar approach was taken to the data on the provision of public water supply and public sewer. The supply of public services to dwellings tends to be dependent on how remote they are with those in rural areas being less likely to have water and sewer facilities. An examination of the data on connection to the public water supply revealed that the greatest disparity tended to be among those councils where the overall provision is lowest. Due to the effect of the urban/rural spread it is not possible to say whether the lower rate of provision, for example, among Catholic households in Fermanagh, is on account of more Protestant households living in urban areas. Information on the availability of central heating within dwellings was collected for the first time during the 1981 Census. Figure 5.5 shows the distribution of central heating across the 26 district council areas. It is clear that there is a disparity between areas which may be partly accounted for differences in the tenure mix. Whatever the cause the data reveal a moderate negative association between the number of Catholic households in an area and the availability of central heating.
The 1981 Census data provides confirmation of the improvement in housing conditions that had been reported in the 1979 HCS (see Section Four). From the available information on religion the Census data shows clear evidence of the narrowing of the gap between the physical characteristics of Catholic and Protestant dwellings. Given the substantial improvement in the relative position of Catholic households, much of which cannot be explained simply in terms of any amelioration of their economic circumstances, there remains the question as to why their position was so markedly inferior in 1971. NOTE
[1] It should be noted that this is less of a problem
than it first appears simply because the availability of one amenity
tends to be highly correlated with the provision of other amenities.
Figure 5.1 Percentage of Catholics, based on 1981 Census figures and adjustments by Compton (1986), district council areas
|
CAIN
contains information and source material on the conflict
and politics in Northern Ireland. CAIN is based within Ulster University. |
|
|
|||
|
Last modified :
|
||
|
| ||
