  Centre for the Study of Conflict
School of History, Philosophy and Politics, Faculty of Humanities, University of Ulster
Centre Publications
[Background] [Staff] [Projects] [CENTRE PUBLICATIONS] [Other Information] [Contact Details] [Chronological Listing] [Alphabetical Listing] [Subject Listing]
Housing and Religion in Northern Ireland by Martin Melaugh
Section 9: The 1991 Census and the 1991 House Condition Survey INTRODUCTION
The intention in this section is to make a
brief examination of some of the most recently available data
on religion and housing. A number of the reports from the 1991
Census have been published and the information contained in them
forms the basis for the analysis in the first part of this section.
The other recent development is the publication of the first of
three reports on the 1991 House Condition Survey. While this first
report does not contain direct information on religion it is
Possible to look at spatial differences in housing conditions
in association with details of the religious composition of those
areas. At the time of writing the reports of the 1991 Census are in the Process of being Published. A number of reports have been issued including, the Preliminary Report (Registrar General Northern Ireland 1991), the Summary Report (Registrar General Northern Ireland 1992), and the Religion Report (Registrar General Northern Ireland 1993) and the series of reports should have been completed by early 1994. The data from the Religion and Summary Reports together Provide enough information to make an assessment of some of the housing characteristics of Catholic and Protestant households. The most important changes that have occurred since the. 1971 and 1981 Censuses are also considered . Appendixes 9.1 and 9.2 contain the data, extracted from the Census reports, used in this section.
Details of the religious composition of the
Northern Ireland Population in 1991 are provided in Table 8 of
the Summary Report. Of the total Population 7.28 per cent refused
to state their religion, that is 'not stated', and 3.75 per cent
answered 'none', a choice which was explicitly open to respondents
for the first time in 1991, making a total of 11.03 per cent who
were not categorised. This compares with 17.41 per cent 'not stated'
in 1981 and 9.56 'not stated' in 1971. In the past Compton (1978)
and Compton and Power (1986) have provided estimates of the religious
composition of the population taking into account those who were
categorised as 'not stated' (estimates were also made of the likely
effect of non-enumeration in 1981). At present there are no population
estimates based on the 1991 Census data which take account of
those 'not stated' so the information in this section is based
on 'unadjusted' religion figures[1]. Between 1971 and 1981 there was a marked fall in the level of private renting and increases in both owner occupation and public rented accommodation. Since 1981 the decline in private renting has continued but there has also been a reduction in the level of public rented, almost exclusively Housing Executive, dwellings and significant increases in the level of owner occupation. The relative standing has remained much the same with Catholic households being more likely to be in public rented accommodation (Catholic 35.6%, Protestant 28.7%) and less likely to be in owner-occupied dwellings (Catholic 58.2%, Protestant 64.6%) than Protestant households.
While, according to the 1991 Census, the average
household size for both Catholics and Protestants continues to
decline, Catholic households remain larger at 3.40 compared with
Protestant at 2.68. In terms of the number of rooms per household
there would appear to have been an important improvement in the
relative standing between Catholics and Protestants since 1981;
the figures are 5.47 and 5.56 respectively. Figure 9.1 shows the
percentage of Catholic and Protestant households living in dwellings
of various sizes. A comparison of this data with information from
the 1971 and 1981 Censuses demonstrates the continuing trend towards
larger dwellings and the decline in the differential between Catholics
and Protestants. While a balance is being achieved in the number
of rooms the continuing disparity in average household size means
that there remains a difference in the average number of persons
per room; Catholic households 0.62 compared to Protestant households
0.48.
Figure 9.1 Percentage of households and
dwelling size by religion, 1991 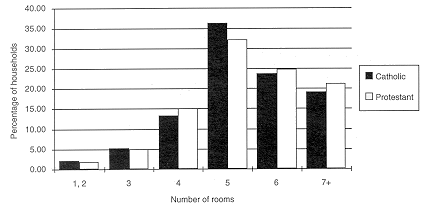 Data for Figure 9.1 There have been substantial improvements in the figures for density of occupation. In 1971 the figures for those households living over a density of one person per room were 29.3 per cent for Catholics and 9.8 per cent for Protestants. By 1991 these figures had become 9.6 per cent and 2.2 per cent respectively. Among Housing Executive tenants, 11.9 per cent of Catholic households were living at one or more persons per room and the equivalent figure for Protestant households was 3.6 per cent. While these figures represent substantial improvements on the situation in 1971 it would appear that the NIHE is still having difficulties coping with the larger household size of Catholics families.
The greatest improvements in housing characteristics
for both communities are to be seer in the figures for housing
amenities. The greatest changes occurred between 1971 and 1981,
with roughly a 20 per cent improvement in the availability of
fixed baths or showers and inside toilets. Since 1981 the improvement
has continued and the overall level for these amenities is now
approximately 98 per cent; see Figure 9.2.
amenities and services by religion, 1991 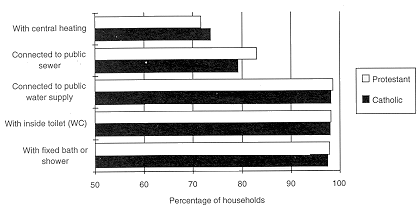 Data for Figure 9.2 In addition there are now only marginal differences between Catholic and Protestant households (compared with the situation in 1971). There has been a slight improvement in the number of households connected to the public water supply since 1981; the figure for Catholic households is now 98.3 per cent while that for Protestant households is 98.8 per cent. Since 1981 there has been very little change in the percentage of households connected to the public sewer; the figures are 79.4 per cent for Catholic households and 83.2 per cent for Protestant households. The 1991 Census included, for the first time, a question on central heating which showed that Catholic households were slightly better provided for at 73.7 per cent compared with Protestant households at 71.8 per cent. This represents a turnaround on the estimates from the CHS for the years 1983-84 which showed that Catholic households were less likely to have central heating (PPRU 1989 p24). DISTRICT COUNCIL DATA
The information available at a district council
level, particularly that provided by Table 8 of the Religion Report,
confirms the improvements noted in the data for the whole of Northern
Ireland. The following discussion gives a brief outline of the
available data. As noted above differences in the average household
size remain one of the main distinguishing features between Catholic
and Protestant households. Figure 9.3 shows the average number
of persons per room by the percentage of Catholics for each district
council area. While there has been an overall improvement in the
density of occupation of Catholic dwellings it is clear that there
remains a strong association between these characteristics.
Catholics, district council areas, 1991 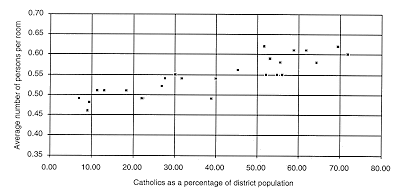 Table 8 of the Religion Report allows a direct comparison of the level of amenity provision between Catholic and Protestant households in each of the 26 district council areas. Data extracted from Table 8 is provided in Appendix 9.2. In the case of both the availability of a fixed bath or shower, or an inside toilet there are only marginal differences between Catholic and Protestant households across the region. Whereas in 1971 there was a 40 per cent difference between the best and worst district council areas by 1991 this figure had dropped to 6 per cent. Figure 9.4 shows the position for connection to the public water supply and it is apparent that in only a few instances is the differential between Catholic and Protestant households greater than 1 per cent.
Catholic and Protestant, 1991 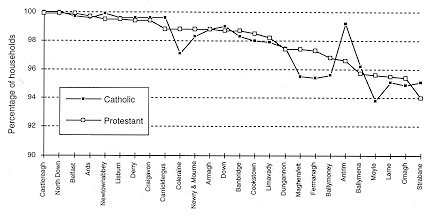 The Census data demonstrates that there is quite a wide range in the availability of central heating as between district council areas, see Figure 9.5. In a number of districts the percentage of Catholic households with central heating is greater than the figure for Protestant households; this corresponds to the figure for Northern Ireland mentioned above. The difference between the religions is not as great however as the differences between some areas. An additional factor, not covered in the Census data, is whether or not the households makes full use of the heating provided. Those on limited incomes may not be able to afford to take complete advantage of their central heating. A comparison with information from the 1981 Census (see Figure 5.5) shows a considerable improvement across all district council areas in the availability of central heating.
Catholic and Protestant, 1991 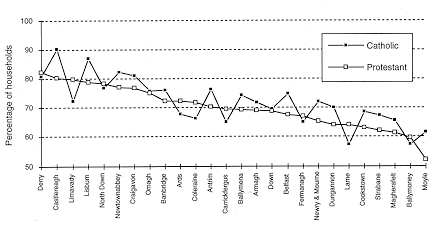 One of the areas where there remains a strong association between religion and housing characteristics is in connection to the public sewer; see Figure 9.6. Due to the cost involved in providing this service to isolated dwellings it is likely that there will remain substantial numbers of households who are not connected to the public system, Given the geographical spread of Catholics in the west of the region it is also likely that differentials will remain between the two main religions. Most of the difference is likely to occur in relation to private sector dwellings.
percentage of Catholics, district council areas, 1991 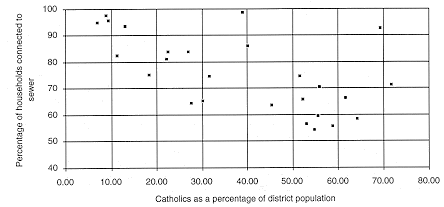 TRENDS IN CENSUS DATA SINCE 1971 The first point to be made on the basis of the housing information from the latest census, is the continuing and dramatic - in comparison with 1971 - improvement in the amenities of the housing stock in Northern Ireland. On many indicators of housing characteristics the geographical differences between the west and south were the most pronounced. Often the differences between the best and worst areas in terms of geographical location was greater than the difference between the religions within areas. The other main feature of the data from the three Censuses is the improvement in the relative standing of the two communities. It is clear that there has been sharp improvement in the housing conditions of the Catholic community relative to Protestant households. There was a particularly large improvement between the 1971 and 1981 Censuses. One question that was raised earlier was whether the improvement in relative housing conditions was evidence that the needs of Catholic households were not entirely being met in previous decades; particularly before the setting up of the NIHE in 1971. Undoubtedly much of the difference observed in the past between Catholic and Protestants was brought about by the lower economic position of the Catholic community. There remains, however, the unanswered question as to how much of the observed difference prior to the formation of the NIHE was due to the discriminatory practices of a number of housing agencies.
In the past the availability of amenities were
themselves highly correlated with other housing characteristics,
such as whether the dwelling was unfit, the general state of repair
and the age of the dwelling. The increase in the provision of
amenities is likely to have brought about a decline in the association
between unfitness and the absence of amenities. Whereas in 1971
this association made it possible to say something of the distribution
of unfitness between Catholic and Protestant dwellings, the nature
of the relationship in 1991 is likely to be less reliable. The NIHE is currently in the process of publishing the reports of the 1991 House Condition Survey (HCS). Unlike previous surveys the Housing Executive intends to publish three reports based on the HCS and a follow-up survey of residents. The first report has recently been published, Northern Ireland House Condition Survey 1991 (NIHE 1993) which provides details of the physical condition of the housing stock. The second report is due for publication in 1994 and will look at the characteristics of the households in relation to the physical stock, and the third also scheduled for 1994 will look at comparisons between Northern Ireland and Britain.
Information on religion was collected in the
follow-up survey, the first time such data was collected in a
survey associated with the HCS. The NIHE will thus have the necessary
information to carry out an analysis of housing condition based
on religion. At present there is no indication as to how much
of this information the NIHE will include in the second report.
As the first report does not contain information on religion and
given that there has, as yet, been no detailed assessment of the
information, this section gives only a brief review of the main
housing condition data. Unlike the previous 1987 HCS the 1991
survey was of sufficient size to allow the results to be broken
down by district council area. This provides an opportunity to
examine the main results on unfitness, repair and amenities in
relation to the percentage of Catholic households in each of the
district councils[2]. Appendix 9.3 contains a summary
of the data used in the following analysis. The results of such
an approach can only be suggestive and a final decision about
the relationship between religion and housing condition in 1991
will have to await the publication of the NIHE second report.
As mentioned earlier the NIHE has carried out regular HCSs since 1974. A central part of the assessment of housing condition is whether or not the dwelling is statutorily unfit. For the purposes of the surveys carried out in 1974, 1979, 1984 and 1987 the standard for unfitness was the same and was based on the 1956 Northern Ireland Housing Act (amended by the 1971 Housing Act and the 1981 Housing (NI) Order). However the standard was substantially changed for the 1991 HCS (in line with changes in England); the legislation concerned was the 1992 Housing (NI) Order. The change has had the effect of breaking the continuity of comparison between the 1991 survey and the earlier ones. However the NIHE have provided estimates of the effect the new standard is likely to have had on the 1987 level of unfitness. The first of the HCSs in 1974 found an unfitness level of 19.6 per cent and by 1987 this figure had been reduced to 8.4 per cent. Using the new standard for assessing unfitness the NIHE have recalculated the 1987 figure and, other things being equal, it is estimated that 11.0 per cent of dwellings would have been unfit in 1987. The 1991 survey found unfitness to be 8.8 per cent of the housing stock. It would appear therefore that making an allowance for the new standard the level of unfitness in the Northern Ireland housing stock has continued to decline. It is clear from an inspection of the unfitness data for the district council areas that there remains an important element of variation in the figures across the region. The lowest level of unfitness was 2.5 per cent in Castlereagh while the highest was 23.3 per cent in Fermanagh (NIHE 1993). This pattern reflects the rural nature of unfitness in the region and in particular that proportion of the housing stock which is located in isolated rural areas. Evidence from the 1991 survey showed that approximated one-third of all farm dwellings in the region were unfit. Figure 9.7 shows the association between the percentage of dwellings in each district council which are unfit and the percentage of Catholics living in the particular area. As mentioned previously this type of association based, as it is, on area data can not prove a relationship between religion and housing condition at the individual household level. However it is likely that observed pattern reflects the pattern of owner occupation of older dwellings among Catholic families living in rural areas in west and south of the region.
district council areas, 1991
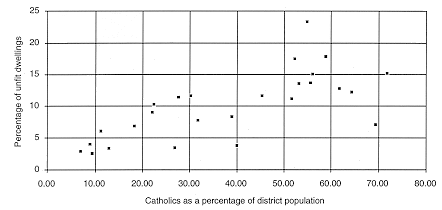 The 1991 data shows a continuing improvement n the amenity provision within the housing stock. The percentage of dwellings lacking one or more basic amenities has declined from 26.2 per cent in 1974 to 3.3 per cent in 1991 (NIHE 1993). While the overall level of the problem is less than the case for unfitness or disrepair, there remain a number of geographical differences in the data. While four of the Housing Executive's regions showed an improvement in the number of dwellings lacking amenities between 1987 and 1991 , there was no significant improvement in the West region. Figure 9.8 provides details of dwellings lacking at least one basic amenity in each of the district council areas by the percentage of Catholics in the particular areas. While the absolute level is less than for unfitness it is clear that there is still an association between a lack of amenity provision and the proportion of Catholics in an area.
percentage of Catholics, district council areas, 1991 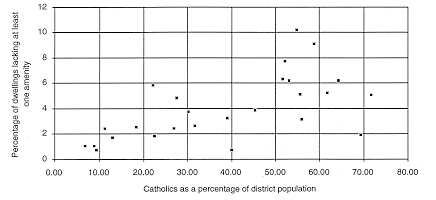
The 1991 HCS procedures for calculating repair
costs were substantially different from those used in 1987. However
the NIHE were able to provide estimates of the 1991 situation
using the 1987 procedures. These figures showed an overall improvement
in the level of disrepair across the whole region from 22.5 per
cent in 1987 to 15.8 per cent in 1991 for those dwellings needing
repairs in excess of £3,000 (NIHE 1993). Disrepair is closely
associated with the age of the dwelling, but private rented and
vacant dwellings and those dwellings in an isolated rural setting
were also more likely to have high repair costs. As in the case
of amenity provision the NIHE's West region showed only a marginal
improvement in the number of dwellings which required repairs
between 1987 and 1991; based on 1987 prices and cost models. There
were wide differences in the level of disrepair between district
councils. In Castlereagh only 2.8 per cent of dwellings required
repairs in excess of £3,000 while in Newry and Mourne the
figure was 22.3 per cent. Figure 9.9 indicates an apparent association
between the level of the disrepair problem and the percentage
of Catholics living in the district council area. A similar pattern
exists for those dwellings classed as being in a poor state of
repair (those requiring repairs in excess of £25 per square
metre).
percentage of Catholics, district council areas, 1991 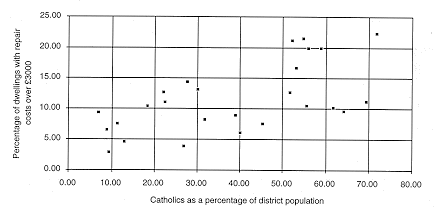 NOTES [1] Estimates such as those provided by Compton and Power would have been useful in examining differences in housing characteristics between the 26 district council areas. Before deciding to use the 'unadjusted' figures of religious composition a number of alternative options were considered. It would be possible, for example, to apply the base percentage figure for Catholics to the 'not stated' figures and thereby assign them pro rata. This adjustment would increase the Catholic figure from 38.38 per cent to 40.99 per cent of the total population. There would be criticisms of this simplistic approach but at least it would be simple in operation. However, an examination of the association between the level of 'not stated' and the proportion of Catholics in each district council area revealed a strong negative correlation. The same was true of those who reported religion as 'none'. In other words it is likely that a larger proportion of those who were 'not stated' were classifiable as Protestant. It is also likely that a large proportion of the 'none' belonged, at one time, to a Protestant denomination. This makes the process of estimating the 'true' religious composition of the population more complex and best carried out on the basis of ward level data.
[2] As mentioned
earlier in this report this type of approach proves only an association
between the two variables under consideration. The approach can
show no actual link between individual Catholic households and
those dwellings in, say, unfit condition.
by religion, 1991
amenities and services by religion, 1991
|