  Centre for the Study of Conflict
School of History, Philosophy and Politics, Faculty of Humanities, University of Ulster
Centre Publications
[Background] [Staff] [Projects] [CENTRE PUBLICATIONS] [Other Information] [Contact Details] [Chronological Listing] [Alphabetical Listing] [Subject Listing]
Housing and Religion in Northern Ireland by Martin Melaugh Section 3: The 1971 Census
INTRODUCTION Although no detailed analysis of the housing data in the 1971 Census has been published, the information does provide an opportunity to examine differences in the housing circumstances of the two main religious groups[1] at a time when housing was high on the political agenda. Information was collected during the Census on a number of aspects of housing including tenure, number of rooms and amenities (cooker, kitchen sink, fixed bath or shower, hot water supply, and flush toilet). By combining this information with details of the household the Census reports provide computed or combined variables, for example, the average number of persons per room, density of occupation, and those households with exclusive use of hot water, fixed bath and inside toilet. This information is all contained in the Religion Tables of the 1971 Census (Northern Ireland General Register Office 1975). Part of the problem with the Religion report is that it only provides housing information at a Northern Ireland level and there is an argument that any observed differences between the two communities are due to structural or geographical patterns rather than any inequality which has resulted from discrimination. Crudely put this argument would state that Catholics tend to be concentrated in the more rural western part of the region (see Figure 3.1) and this is where much of the unfit housing (and by association that housing with least amenities) happens to be. To try to examine this argument further it is necessary to look at some of the other Census reports which provided a breakdown of the data by geographical areas'. Unfortunately these tables, such as the County Reports, do not provide information on religion. The best available approach therefore, for information from the published reports, is to correlate the housing information with the percentage split between Protestants and Catholics in each of the selected areas[2]. Such correlations are not without problems but they provide a reasonable assessment of the material differences between the two communities. Those Census reports which provide a breakdown of housing variables by the 26 district council areas, created in the 1973 reorganisation of local government, also lack the religion variable, but again the data can be examined in the light of the percentage split between the two communities. The advantage of using the district council areas is the ease of extracting information for 26 areas, the disadvantage is the size of the areas and population covered and many variations are lost in the aggregation. The information based on administrative area has the advantage of greater detail but at the cost of the extra time taken to extract the data. Working at the level of district electoral divisions there are 83 administrative areas which can be examined. These are the 83 areas for which the religious denominations are provided in table 8 of the County Reports. There is the additional problem in estimating the percentage of Catholics from the 1971 Census because of the number of 'not stated'. Compton (1978) has provided estimates of the percentage of Catholics in each of the 26 district councils and these figures are used in the appropriate tables. There are, however, no estimates for the percentage of Catholics in the 83 administrative areas selected from the county reports and in this instance the number of Catholics reported in the tables is expressed as a percentage of the total population. While the response rates have been shown to have varied by religion and by area, the overall effect is likely to be that the percentage estimates for Catholics in the 83 administrative areas understate the true figure. As much of the comparative analysis is based on rankings it would be reasonable to assume that the effect on any broad conclusion reached is likely to be minimal. As mentioned above, the information on amenity provision by religion in Table 7 of the Religion Report was of limited use. This was due to the fact that, whereas in the 1981 and 1991 Religion Reports the information on housing amenities is broken down by district council, in 1971 only a Northern Ireland summary was available. This proves to be an unfortunate gap in the published data for anyone interested in housing for the two communities at the beginning of the 1970s. Fortunately, researchers at Queen's University hold sections of the 1971 Census data on a computer and agreed to supply the author with information from Table 7 broken down by district council area. This new information provides the basis for an assessment of religion and housing amenities at district level.
Given the type of information that is available the outline for
this section is as follows. The first part will consider housing
variables broken down by religion at a Northern Ireland level.
Information will also be provided at a district council level
and associations between this data and estimates of the percentage
of Catholics in each area will be examined. In addition, some
basic variables will be considered for the 83 administrative areas
based on wards, and urban and rural districts. Table 6 of the 1971 Religion Report showed marked tenure differences between the two communities with Catholic households less likely to be owner occupiers than Protestants (42.3% and 47.8% respectively), more likely to be in public rented accommodation (40.9% and 32.2%), and less likely to rent privately (16.1 % and 20.5%). Information was also provided in Table 6 on density of occupation by tenure. Whereas it is possible to explain differences in overcrowding in the private sector in terms of person choice such explanations have less validity in the public sector where housing need is the supposed to be the determining factor. In the case of Catholic households who rented from a local or public authority, 36.0 per cent were living at more than one person per room, the equivalent figure for Protestant households in the same tenure was 15.5 per cent. It would appear from this data that the various agencies providing public housing were unable to cope with the needs of Catholic families who, for mainly religious reasons, tended to be larger than their Protestant counterparts. Information on the average household size and the average number of persons per room[3] is contained in Table 4 of the Religion Report. The average Catholic household size was 4.15 persons while the figure for Protestant households was 3.17. The average number of persons per room reflects the difference in household size. In Catholic households the average number of persons per room was 0.89 while in Protestant households the figure was much lower at 0.62. Although figures for the bedroom standard are not available, it is clear that the information on average persons per room indicates that there were higher levels of overcrowding in Catholic households. Table 4 of the Religion Report also allows some indication to be made of how well the size of dwelling matches the size of the household. What is clear from Figure 3.2 is that a greater percentage of Catholics lived in dwellings with four or fewer occupied rooms, while a larger percentage of Protestants lived in dwellings with 5 or more rooms. Figure 3.2 Percentage of households and dwelling size by religion, 1971
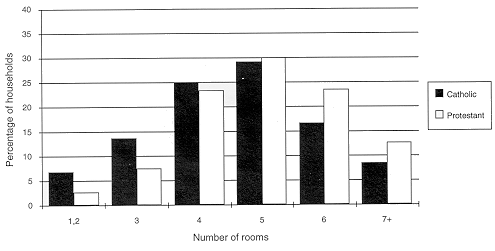 So even though the average Catholic household size was larger than the average Protestant household, Catholics tended to live in smaller dwellings. More information on the density of occupation based on the number of persons per room is provided in Table 5 of the Religion Report. At all levels the figures for Catholic households are significantly higher than other denominations. For example, 29.3 per cent of Catholic households live in dwellings at a density of more than one person per room while the figure for Protestant households is 9.8 per cent. It should be remembered that as the size of a family changes a dwelling which was suitable in the past may no longer meet the family's needs. The household may however be satisfied to remain in the 'family home' at the cost of pressure of space. Information on the bedroom standard is presented in Section Seven. Details of the level of amenities (hot water supply, fixed bath or shower, and inside toilet) in dwellings broken down by religion are provided in Table 7 of the Religion Report. Figure 3.3 shows the percentage of households that had exclusive use of the specified amenities broken down by religion. It is clear from the data that there were important differences in the level of amenities in the dwellings of the two communities in 1971. In each case the availability of exclusive use of amenities in Catholic households is substantially lower than in Protestant households. 63.6 per cent of Catholic dwellings had exclusive use of all three amenities while the figure for Protestant dwellings was 72.0 per cent. Figure 3.3 Percentage of households with exclusive use of specified amenities by religion, 1971
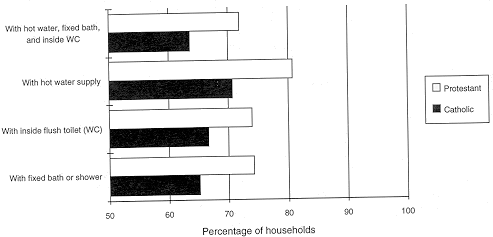 The general picture of housing characteristics at a Northern Ireland level is one of poor amenity provision for a substantial number of households. There was at that time a strong correlation between amenity provision and unfitness, and as the later 1974 Housing Condition Survey was to show approximately 20 per cent of dwellings were unfit for human habitation (NIHE 1974). Although the housing situation was very poor for a substantial number of people of both main religions it is also clear that Catholic households were significantly worse off in terms of overcrowding and amenity provision. It is also probable that more Catholic households lived in dwellings which were unfit for human habitation.
Part of the explanation for the observed differences between the
two communities was covered in the material in Section One. New
dwellings built in rural areas during the inter-war years tended
to be built to a very low standard and had fewer amenities, particularly
the services of mains electricity, mains water, and public sewer.
A greater proportion of Catholic households live in the western
rural areas of Northern Ireland and so would be more likely to
live in this type of accommodation. There is no information in
the published reports which allow a direct comparison of amenities
by religion by geographical area so this type of analysis can
only be carried out below on the basis of data supplied by Dr
John Power[4]. The Summary Report of the 1971 Census provides household information for the 26 district council areas. Using Compton's estimates of the percentage of Catholics in each of the areas it is possible to chart the relationship between the proportion of Catholics in a council area and some of the information considered above. While the proportion of individual Catholics in any particular area tends to be higher than the proportion of Catholic households (because of differences in average household size between Catholics and Protestants) these two sets of figures are very highly correlated. Appendix 3.1 contains the data used in the following analysis. As mentioned above there are a number of problems in using this type of data in this fashion. However, given the lack of data on housing characteristics and religion from the various housing agencies, this type of data represents the next best source of information. In an effort to check the supply of dwellings to the two communities the number of dwellings per 1,000 households was calculated in each council area and these figures were then plotted against the proportion of Catholics. While the situation is not entirely clear cut, the data suggests a significant negative association between the proportion of Catholics in a council area and the provision of dwellings in relation to the number of households. Catholic households were more likely to be sharing accommodation and are therefore more likely to be experiencing housing need. An examination of the percentage of dwellings owner-occupied by the percentage of Catholics in the district council areas, demonstrates one of the problems of using this type of analysis. It would appear from the data that there is a slight positive (non-significant) correlation between the number of Catholics and the percentage of owner-occupied dwellings. However, as already pointed out the tenure table of the Religion Report indicates that Catholics were less likely to be owner occupiers. The explanation is possibly due to the effect of an intervening variable such as whether the district council population is mainly rural or urban. The same could be said of public renting which appears to show a negative (non-significant) association with the proportion of Catholics. The two variables which provide an indication of overcrowding, the average number of persons per room and the percentage of households living at a density of more than 1.0 person per room (Figure 3.4), both show a strong positive association with the number of Catholics. These strong associations reflect the information above on the larger average size of Catholic households and also the fact that their dwelling size tended to be smaller than that occupied by Protestant households.
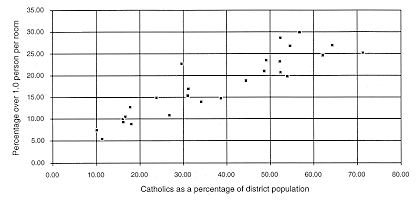 There are strong negative associations between the proportion of Catholics in each district council area and the level of amenities within dwellings.Figure 3.5, for example, shows a clear association between the proportion of Catholics in each district council area and the proportion of households with exclusive use of hot water, a fixed bath or shower and an inside toilet.
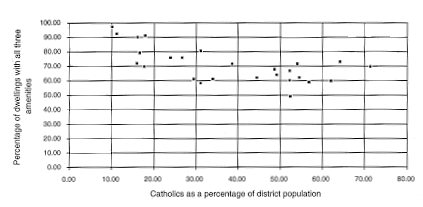 Similar strong negative correlations were obtained when the amenities were considered separately. Figure 3.6 is a map of the distribution of the percentage of households with exclusive use of a fixed bath or shower by district council area. One issue that arose from the discussion in Section Two was the argument that differences in the housing circumstances of Catholic and Protestants had their basis in structural problems, mainly the geographical distribution of the main religions, rather than overt discrimination. As a check on this argument data on the number of households employed in farming was extracted from the 1971 Census Housing and Households Report. This variable acts as a surrogate for the extent to which an area can be regarded as predominantly urban or rural in character. A fairly strong association between religion and the percentage of households employed in farming was found in the 26 district councils. This association reflects the geographical distribution of Catholics across the province with many living in rural areas in the west and south of the region (see Figure 3.1). This relationship means that a number of variables are interrelated, namely, the proportion of Catholics, the extent to which an area is urban or rural, and also the type, condition, amenities and services provided to dwellings. On the basis of data supplied by Dr Power an analysis of the provision of housing amenities by district council was carried out for Catholic and Protestant households. The first step was to calculate the proportion of Catholic and Protestant households that had exclusive use of a fixed bath or shower, an inside toilet, or a hot water supply, and finally the combination of all three amenities. The information on each of these four categories of amenity is set out in Appendix 3.2. Each category of amenity was graphed on the basis of a ranking from the highest Protestant district council to the lowest[5]. Figure 3.7 shows the graph for the combination of all three amenities (the other graphs, which were similar in result to this one, are contained in Appendixes 3.3, 3.4 and 3.5).
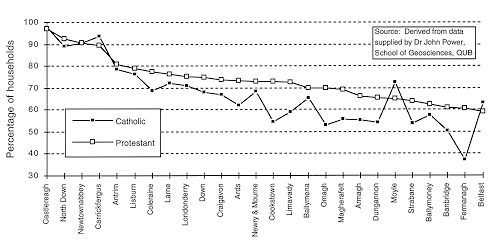 There are two things that are immediately clear from Figure 3.7. The first is the huge differential in amenity provision between district councils in the Greater Belfast area, such as Castlereagh, North Down, Newtownabbey and Carrickfergus, and those in the rest of the region, particularly in the west and south. The spread in the percentage of households which had all three amenities is, from today's perspective, quite startling . Even among Protestant households there was a 40 per cent difference between the district council area with the highest level of provision and that with the lowest. The second obvious point is the significant difference between Catholic and Protestant households, with Protestant households being more likely to live in dwellings with amenities. This is true for all but 4 of the 26 district council areas.
While undoubtedly other factors not present in the data, such
as the breakdown of tenure among the communities and underlying
economic inequalities, will account for some of the differences
observed in Figure 3.7 (and the graphs in Appendixes 3.3.
to 3.5) there remains a question mark. Just how much of
the difference is due to discriminatory practices outlined in
Section Two? It is certainly the case that many of the very areas
which were most active in agitating for housing reform during
the Civil Rights movement are those that had a low level of provision
and where Catholic households had significantly poorer amenity
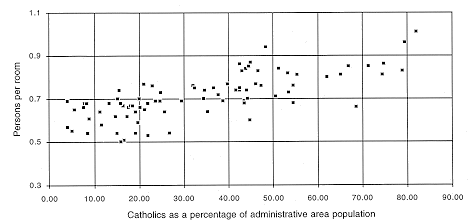
provision than their Protestant neighbours. In order to examine the effect of the geographical distribution of Catholics and Protestants across Northern Ireland in more detail, data was extracted from the County Reports of the 1971 Census (Northern Ireland General Register Office 1975). The decision about the geographical level to be chosen was determined by Table 8 in each County Report which gave information on religious breakdown. This resulted in 83 administrative areas being selected, based on wards, municipal boroughs, urban districts and rural districts. As was mentioned above, the religious composition in each of these areas was calculated on the basis of those who indicated that they were Catholic as a percentage of the total population in the area, including those 'not stated'. There are no published estimates of the proportion of Catholics in these areas that make adjustments for the category 'not stated'. For reasons discussed earlier the use of the unadjusted figures is likely to underestimate the proportion of Catholics in many of the areas. The variables extracted included data on overcrowding, and details of amenity provision. The data used in the following analysis is included in Appendix 3.6. From the data extracted it was possible to calculate the number of dwellings per 1,000 households which gives a rough indication of housing shortages in each of the areas. While information on waiting lists, to be considered in later sections, is the more direct approach the census data allows a brief assessment of the mismatch of dwellings and households. For all of the 83 administrative areas there was a slight negative association between the number of dwellings per 1,000 households and the proportion of Catholics. The picture was slightly complicated by a small number of Protestant areas which had provision significantly lower than other predominantly Protestant areas. Of these Protestant areas two were in the west of the province. The general picture is of a shortage of housing across the whole of Northern Ireland. Both the measures of density of occupation, that is, the number of persons per room (Figure 3.8) and the percentage of households living at a level of more than one person per room, are strongly associated with the proportion of Catholics in the administrative area. When considered with the regional information on the size of household and size of dwelling it would appear that the pattern of larger Catholic households living in dwellings with fewer rooms than those of other denominations is repeated across local areas.
 The overall picture on amenities across all 83 administrative areas is less clear than the evidence on overcrowding. However, there are slight negative associations between the percentage of Catholics in an area and the provision of hot water, fixed bath or shower, inside toilet, and all three amenities. Figure 3.9 shows the percentage of households that had exclusive use of all three amenities compared the proportion of Catholics in each area.
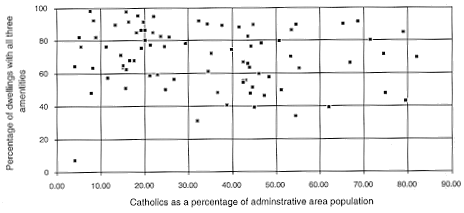 An interesting point is the fact that these associations are less strong than is shown by the data at district council level. The figures for the number of Catholics in each area are, as mentioned above, based on unadjusted data and this may be having some effect on the data. It is also possible that one other variable, for example whether the area is urban or rural, is having an intervening effect on the association. The area with the lowest level of amenity provision in Figure 3.8 is a predominantly Protestant ward in Belfast. This is a useful reminder that many Protestant working class areas at that time had dwellings which were as equally bad as those in Catholic areas.
One question which arose earlier was the impact of tenure on some
of the dwelling characteristics considered above. In particular
what was the spread of public rented accommodation between the
two communities and what impact did this have on the level of
amenities to be found in dwellings? Across all 83 administrative
areas there was a slight positive association between the proportion
of Catholics and the level of public renting. Given that Catholic
households tended to be in greater need this outcome is not surprising.
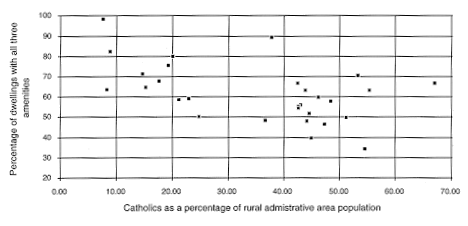
Of the 83 administrative areas, 29 were classed as rural districts in the County Reports with the remaining 54 classed as urban districts, municipal boroughs or wards in urban areas. It was decided to use this classification to check for the effect of any urban/rural split in the characteristics of the data so far explored. Having split the data into urban and rural areas a number of clear distinctions were found. In the case of the number of dwellings per 1,000 households there was no change in the figure quoted above for the 54 urban areas. However, for the rural areas there appears to be a more distinct negative association in the number of dwellings and the proportion of Catholics. This data would appear to provide tentative evidence of a shortage of housing in predominantly Catholic rural areas. Whereas there was little change to the associations between religion and overcrowding, the introduction of the third variable did have a Pronounced effect in the case of amenities. In the 54 urban areas there was little association between the proportion of Catholics and the provision of amenities. However, in the case of the 19 rural areas there were quite strong negative Associations between Catholic population and the provision of hot water, fixed bath or shower, inside toilet, and also those dwellings which had all three amenities. Figure 3.10 shows the association between the proportion of Catholics and the variability of all three amenities. It would seem therefore that while in general terms rural dwellings tended to have fewer amenities, Catholic households in all rural areas tended to live in dwellings with fewer amenities than households from other denominations. This information confirms the findings for the 26 district council areas.
 When the level of public rented accommodation was considered for all the administrative areas there was a slight positive association with the proportion of Catholics in the areas. When rural and urban areas were considered separately two different pictures emerged. In urban areas there was a moderate positive association with the proportion of Catholic households. In rural areas the association was almost at the same level but in the opposite direction. It would seem that in predominantly Catholic rural areas there were fewer public sector houses available. This data ties in with the information presented in Section Two which pointed to a lack of public sector housing provision by both the NIHT and local authorities in rural areas, particularly in the south and west of Northern Ireland. NOTES [1] For the purpose of the analysis of the Census data the main religious groups were classified as Catholic, Protestant (mainly Presbyterian, Church of Ireland, and Methodist, but also including those classified as Other denominations') and those categorised as 'Not Stated'. [2] The Local Government (Boundaries) Act (Northern Ireland) 1971 and the Local Government Act (Northern Ireland) 1972 both resulted in changes to the administrative boundaries within Northern Ireland. These Acts established the District Council Areas which came into being on 1 October 1973. While the 1971 Census was carried out before these changes many of the Census reports were not published until after the reorganisation so some of the Census reports are based on District Council Areas and some are based on the older local authority areas. The Census County Reports provide information that can be used to examine differences in housing for counties, local authority areas, wards, district electoral divisions, and towns and villages with 50 or more houses. These Reports were used to extract data on 83 administrative areas. [3] Measures of household density based on the number of rooms suffer from two main problems. The first is that they take no account of the age or sex structure of the household (the bedroom standard is a better measure in this respect) and the second is that there is no allowance made for the size of the room. A dwelling could undergo major renovations which, for example, results in a sitting room and a dining room being turned into one larger room. This would have the affect of increasing the person per room figure without any change to the total size of the dwelling. [4] The author is grateful to Dr John Power, School of Geosciences, The Queen's University of Belfast, for supplying a set of tables giving a breakdown of household religion by dwelling amenity by district council area. On the basis of this data the author was able to extract the information in Appendix 3.2 and produce Figure 3.7 and also the Figures in Appendixes 3.3, 3.4 and 3.5.
[5] It should be noted that these rankings do not take
account of the number of households in each of the district councils.
Thus any large difference in, for example, the Belfast figures
is going to affect more households than a similar difference in,
say, Moyle.
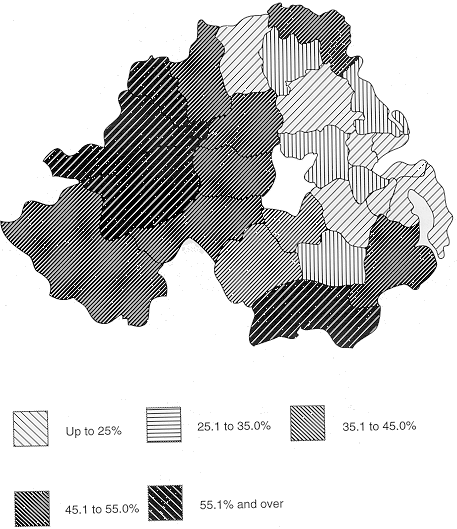 Back to text Figure 3.6: Percentage of households with exclusive use of a fixed bath or shower, based on 1971 Census figures, district council areas 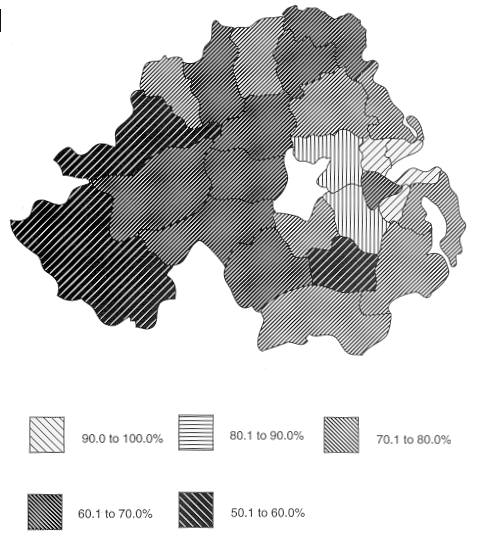 Back to text
Last Modified by Martin Melaugh : |