  Centre for the Study of Conflict
School of History, Philosophy and Politics, Faculty of Humanities, University of Ulster
Centre Publications
[Background] [Staff] [Projects] [CENTRE PUBLICATIONS] [Other Information] [Contact Details] [Chronological Listing] [Alphabetical Listing] [Subject Listing]
Employment, Unemployment and Religion in Northern Ireland by A M Gallagher
Protestants and Catholics are not evenly distributed throughout Northern Ireland (Compton, 1978) and so the location of industry can effect employment opportunities for the two communities. The symbolic representation of this issue focuses on the River Bann which roughly divides Northern Ireland into two halfs, the mainly Catholic west of the Bann and the mainly Protestant east of the Bann. Government policy towards inward investment and sponsored employment has been subject to a number of studies given that this is one area where some empirical evidence on claims of discriminatory treatment of different regions of Northern Ireland is available.
A useful background to this debate was provided by Hoare (1981) who examined political arguments in the Stormont parliament over government support to industry, specifically in regard to the issue of industrial location policy. Hoare began by examining the basic facts of the situation. He pointed out that prior to the Second World War the government had little success in attracting external industry to Northern Ireland, but that in the post-war period the situation changed. Between 1945 and 1965 120 externally-based manufacturing plants were established in Northern Ireland by British (98) and overseas (22) companies. By 1966 these were estimated to have provided 39,800 jobs, or 21.3% of Northern Ireland's manufacturing employment. Subsequent expansion of this industrial activity up to 1976 suggested that an estimated 64,100 factory jobs, 44% of manufacturing employment, had been sponsored by public money. Between 1945 and 1959 75% of manufacturing plants sponsored by government were located within 30 miles of Belfast (23% within Belfast County Borough). Between 1960 and 1973 65% of sponsored plants were established within 30 miles of Belfast (11% within Belfast County Borough) and the total number sponsored was double that of the earlier period (Hoare, 1981, p154; Hoare, 1982, p204). Clearly then the basic pattern was that sponsored industry was concentrated in the east of the province in the environs of Belfast. Hoare went on to compare this pattern of sponsored employment with three other spatial distributions:
Firstly, various measures of economic health (unemployment, long-term unemployment, taxable incomes and employment structure) all pointed to an advantaged position in the east of the province. Hoare concluded that 'the locations selected by sponsored industrial investment confirm rather than reduce existing levels of intra-regional inequalities' (Hoare, 1981, p156). Secondly, as was pointed out above, the geographical distribution of Catholics and Protestants revealed disproportionately more Catholics in the west and disproportionately more Protestants in the east. Thirdly, the political geography of the Northern Ireland parliament mirrored the religious distributions, with Unionists elected in predominantly Protestant areas and Nationalists elected in predominantly Catholic areas. Hoare summarised the patterns thus: 'In sum, then, the general pattern that emerges, up to direct rule of March 1972, is of the minority, Catholic community electing the Stormont representatives on the opposition benches to represent peripheral, impoverished areas of Northern Ireland. The wealthier districts of the east returned the Unionists that comprised successive Stormont administrations, largely through the votes of Protestant electors' (Hoare, 1981, Ppl56-157).
Hoare then went on to examine opposing perceptions of these patterns. Nationalists MPs, he pointed out, consistently complained that the government was directing inward investment to unionist areas, that is, discriminating against Catholic, or nationalist, areas (see also, Farrell, 1980). Successive Unionist ministers not surprisingly disagreed with this view and argued that it was the investors who choose specific locations rather than the government (see Murie et al., 1972/3). A different view was presented by O'Dowd (1981) who pointed out that direct Government infrastructural development followed, rather than preceded, the onset of major inward investment. However, O'Dowd went on to argue that the Unionist Government did have an electoral incentive in favouring the east of Northern Ireland, but did not have to adopt a pro-active policy of encouraging inward investment to this area since this is where most of the major investments were located in any case. In this view the guilt of the Government was of neglect of the west, rather than active discrimination against the west. Hoare highlighted the difficulty at arriving at any 'objective' assessment of this debate given the multitude of intervening variables (though see Hoare, 1982, for the initial steps in such an analysis). He concluded 'What is obvious ... is that two very different public images have been built-up from a common spatial base. And in so far as the Opposition (Nationalist) case both reflected and reinforced the wider credibility gap existing between Ulster's two political factions on all matters of mutual concern, it contributed to Catholic feelings of economic discrimination ... and thus the civil ferment that ultimately overwhelmed Stormont and the monolithic Unionist party' (Hoare, 1981, p173).
As part of its series of investigations of employment issues, the Fair Employment Agency commissioned a research study of industrial location policy between 1949 and 1981 (Bradley et al., 1986; see also, Appendix V, Eleventh annual report of the FEA, 1988). The two main objectives of this study were firstly, to identify where firms receiving government assistance between 1949 and 1981 located, what employment they generated and the religious composition of the areas involved; and secondly, to examine the influence of other factors on location decisions. Bradley et al. divided Northern Ireland into a number of geographical units, based on employment service office (ESO) areas, and compared the number of assisted industrial projects (and employment generated) with various population indices. For the purposes of these comparisons they assumed that within each ESO area assisted firms did not discriminate in who they employed. On that assumption an advantage would accrue to one of the two communities if location was biassed towards areas of Northern Ireland where that community predominated.
Before presenting their findings Bradley et al. examined the various government reports which influenced the formation of industrial policy towards inward investment. They identified three main periods of government policy. Bradley et al. suggested that from 1949 to 1963 a passive policy was adopted towards inward investment, best characterised by a laissez-faire approach. By contrast, after 1963 government adopted an active policy towards inward investment. The period between 1963 and 1975 was characterised by a 'growth centre' policy which involved an attempt to concentrate investment in designated major urban areas. The third period, from 1974 to 1981, was marked with a shift towards greater diffusion and a more explicit recognition of regional imbalances in unemployment. The active policy period from 1963 onward was initiated by the publication of the Matthews Report (1963) which sought to limit the growth of Belfast as it was felt that increased concentration of the population there was detrimental to Northern Ireland as a whole. Matthews proposed a stop-line for Belfast, the designation of development centres to take the population overspill from Belfast and the development of a new city (Craigavon) to act as an alternative magnet to Belfast. All the development centres were located east of the Bann, but several key centres (all but one west of the Bann) were designated to try to stem the population drift from rural areas to Belfast. This basic approach of concentrating growth in designated centres was largely accepted up to 1975. This approach did not take any explicit account of intra-regional unemployment differences, and where targets for employment were set they were on a province-wide basis. Bradley et al. discussed at some length the arguments advanced to support the growth centre philosophy (including efficiency, economies of scale and infrastructure costs) and concluded that they were generally not based on empirical evidence, nor did they find the arguments particularly compelling. After 1975 the growth centre approach was loosened, largely because it was not judged to have been a success. The period following to 1981 coincided with the reorganisation of local government into twenty-six district areas, and saw a greater recognition of intra-regional differences in unemployment and the need to do something about this. In their quantitative assessment of industrial location policy, Bradley et al. measured the relationship between (a) the percentage number of assisted locations and (b) the percentage employment generated by these assisted firms, with (i) the percentage population and (ii) the percentage unemployment in areas. In addition they calculated the probability that a Catholic or non-Catholic would gain employment in an assisted project. For the overall period 1949-8 1, and for the period 1949-63, eleven of the ESO areas had a proportion of Catholics that was greater than the proportion of Catholics in Northern Ireland as a whole. For the period 1964-8 1 twelve ESO areas had a greater than average proportion of Catholics (this designation is calculated from table 6.1, Bradley et al., 1986 p68). In the examination of Bradley et al.'s results below, these areas are designated as Catholic areas and the remaining ESO areas are designated as Protestant areas. Thus for the periods 1949-81 and 1949-63 there were eleven Catholic and eight Protestant areas, and for the period 1964-8 1 there were twelve Catholic and seven Protestant areas.
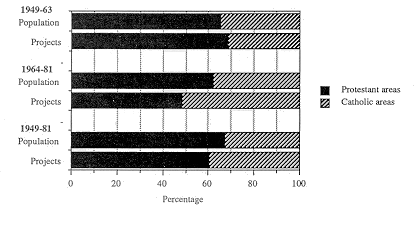
Between 1949 and 1981 Bradley et al. identified 506 assisted projects. Approximately 60% of these assisted projects were located in Protestant areas while the remaining 40% were located in Catholic areas. Figure 6.1 compares the proportion of projects located in Protestant and Catholic areas with the proportion of the total population in those areas. The figure presents information for the overall period, 1949-8 1, and for the two sub-periods, 1949-63 and 1964-81. In this comparison an area would be advantaged if the proportion of assisted projects located in the area was greater than the proportion of the total population living in that area. Figure 6.1 shows that over the entire period Catholic areas were relatively advantaged in the location of assisted projects. In the earlier period Protestant areas had a slight advantage, but this pattern was reversed for the post-1964 period when just over half of the assisted projects were located in Catholic areas, which contained about 38% of the total population.
This advantage to Catholic areas was slightly reduced by a greater rate of closures of assisted projects. Thus, of the 304 assisted projects located in Protestant areas 134 (44%) subsequently closed, while of the 202 projects located in Catholic areas 97 (48%) subsequently closed.
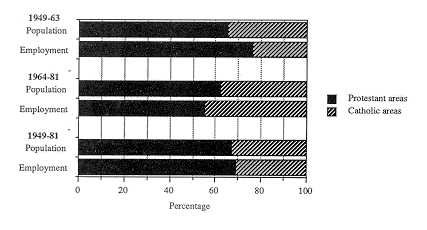
Given that assisted projects generated different amounts of employment it was also necessary to examine the amount and location of assisted employment. For example, it can be calculated from Bradley et al.'s data that the average employment per project was higher in Protestant areas in comparison with Catholic areas (224 jobs vs. 167 jobs: calculated from data in table 5.1, Bradley et al., 1986). The impact of this was assessed in two ways, by comparing the proportion of assisted employment in Protestant and Catholic areas with (a) the proportion of the population in those areas, and (b) the proportion of the unemployed in those areas. Figure 6.2 shows the comparison of assisted employment with population for the entire period and for the two sub-periods. On this figure advantage accrued to an area if the proportion of assisted employment was greater than the population proportion of that area. The figure indicates a slight advantage for the Protestant areas for the entire period 1949-8 1. This suggests that while the number of projects located in these areas might have been less than the population in these areas (cf. figure 6.1), these projects generated a disproportionate amount of employment because they tended to be larger investments.
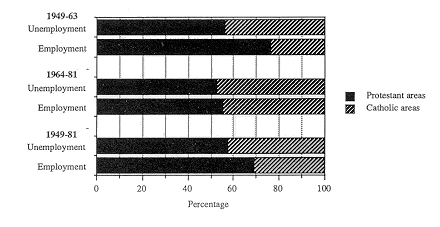
 This overall pattern of advantage to Protestant areas was not repeated when the two sub-periods are examined separately. Between 1949-63 Protestant areas had a marked advantage in assisted employment, but between 1964-81 relative advantage in the location of assisted employment shifted to Catholic areas. Figure 6.3 shows the comparison of assisted employment with unemployment. The rationale for this comparison is that assisted employment should have been directed to areas of unemployment. For this comparison an area was at a disadvantage if the proportion of assisted employment fell short of the proportion of the unemployed living in that area. Figure 6.3 shows a pattern of disadvantage to Catholic areas overall and in both sub-periods. Between 1949-63 the disadvantage to Catholic areas was very marked; between 1964-81 this disadvantage was much reduced, but still remained.
 Probability of being employed in an assisted project Bradley et al. calculated the probability that a Catholic or a non-Catholic would gain employment in an assisted project. They found these probabilities to be practically identical.
Bradley et al. summarised their findings as follows: in general the areas with the highest non-Catholic proportion of the population were located in the east of Northern Ireland, while the highest proportions of Catholics were found in the west. The east areas had less unemployment and were economically more attractive in that they were closer to the main urban centres and transport facilities (airports and docks). Thus a laissez-faire approach to industrial locations would be more likely to benefit the east areas, while an approach directed at areas of higher unemployment would be more likely to benefit the west of Northern Ireland. This was broadly what they found: in the passive policy period economic criteria appeared to predominate so that areas of the east were generally favoured for industrial locations and for assisted employment. By contrast, during the active policy period, which increasingly gave attention to regional differentiation, areas in the west began to benefit as an increased proportion of assisted projects located in this area. Notwithstanding this, larger firms, ie assisted projects which generated the highest amount of employment, tended to locate close to urban centres and transport facilities: thus Antrirn/Carrickfergus/Larne, Londonderry and Ballymena/Ballymoney benefited most from the inward movement of multi-national firms. In terms of the number of assisted projects rural areas in the west and away from Belfast appeared to have done well, but because they tended to be small projects the employment benefit accrued was less than the number of locations might have suggested. Bradley et al. concluded overall that their evidence did not point to any discrimination in industrial location policy. However, it seemed clear to them that up to 1963 economic criteria were predominant in location decisions so that the south and west of the province were relatively neglected compared with the east. From 1964 onwards, the active policy period seemed to correct some of these imbalances with greater attention being given to regional differentiation in unemployment rates.
The most recent evidence on the relationship between location of assisted employment and unemployment was examined in the Belfast Telegraph (24/9/90) where a comparison was made between unemployment and IDB job promotions in each of the seventeen parliamentary constituencies in Northern Ireland. Table 6.1 summarises this information. Table 6.1 highlights a number of features: firstly, over a quarter of all job promotions were in the South Antrim constituency and no other constituency had as much as a tenth of the total job promotions. Secondly, there was a very low level of job promotions in all of the Belfast constituencies, particularly in North, West and East Belfast. Thirdly, the constituencies with the highest proportions of unemployed were Foyle (10.1%) and West Belfast (9.4%) but while Foyle had a relatively high level of promoted jobs (7.3%), West Belfast had one of the lowest levels (0.9%). Commenting on these figures Dr Graham Gudgin, Northern Ireland Economic Research Centre, said that they did not indicate locational policies on the part of the 1DB. Firstly, many promoted jobs are in existing firms, therefore the location of these promoted jobs will depend on the already existing pattern of industrial location. Secondly, firms which wish to expand tend to opt for green-field sites and, in particular, are loath to invest in urban locations (see Gudgin and Roper, 1990, for an extended discussion of these issues).
NOTES
Data for figure 6.1: Assisted projects and population by religion,
area and tune (percentages)
Last Modified by Martin Melaugh : |
