  Centre for the Study of Conflict
School of History, Philosophy and Politics, Faculty of Humanities, University of Ulster
Centre Publications
[Background] [Staff] [Projects] [CENTRE PUBLICATIONS] [Other Information] [Contact Details] [Chronological Listing] [Alphabetical Listing] [Subject Listing]
Employment, Unemployment and Religion in Northern Ireland by A M Gallagher
There exist numerous accounts of the development and structure of Northern Ireland's economy. Rather than attempt a synthesis of this published material, this section will chart some of the broad features of the development of the economy. The main part of the section will examine the changing pattern of industry in Northern Ireland using information from the 1926, 1961, 1966, 1971 and 1981 censuses. A much more detailed picture of the structure of the economy in recent years can be gained from Eversley (1989), in particular in the Additional Tables for that book published by the Fair Employment Agency. The final part of the section will point to some of the demographic characteristics highlighted by Eversley as relevant to the economy.
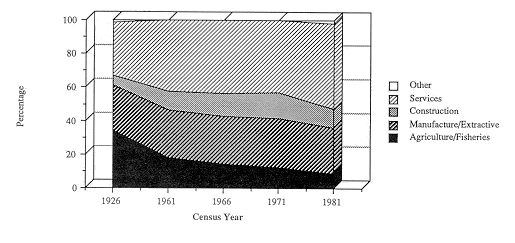
Men Figure 2.1 shows the industrial profile of the employed male population of Northern Ireland from 1926 to 1981. The first most striking feature of this figure is the decline in the proportion of men employed in agriculture and fisheries: from over a third in 1926 to less than a tenth in 1981. Allied to this was the post-Second World War growth in the services sector: in 1926 a little over 30% of men were employed in this sector, between 1961 and 1971 the proportion stayed stable at just over 40%, but by 1981 the proportion had risen to just over half of the employed male population. The proportion of men employed in manufacturing and extractive industries steadily increased until 1971, but then dropped over 2% between 1971 and 1981. The 1960s also indicated a rise in the construction industry followed by a marked fall between 1971 and 1981.
Women
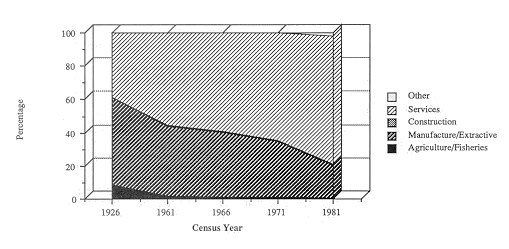
The changing industrial profile of employed women (figure 2.2)
shows both less sectoral differentiation and a marked change in
the pattern of employment. Over 90% of employed women have always
been in manufacturing or service industries, but whereas over
half of employed women were in manufacturing in 1926 (predominantly
textile industries) by 1981 over three-quarters of employed women
were in service industries. Particularly noteworthy in the development
of these patterns was the dramatic drop in the proportion of employed
women in manufacturing between 1971 and 1981.
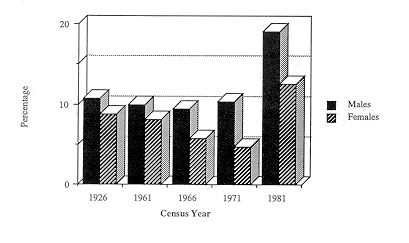
Proportions 'out of work' While the figures above indicate the type of industries within which the working population was employed, the censuses also provide information on the proportion of economically active persons who were out of employment (figure 2.3). In 1926 the proportions of those available for work but out of employment were 11% of men and 9% of women. The proportion of men out of work hovered around the 10% mark for each of the 1961, 1966 and 1971 censuses, while that for women dropped from 8% in 1961 to 5% in 1971. Between 1971 and 1981, however, the proportions out of work rose considerably reaching 19% for men and 13% for women.
The basis of these figures should be noted: there is no 'objective'
method for calculating unemployment levels, as evidenced by the
controversy surrounding the Government's definitional changes
over the last ten years (The Guardian, March 15, 1989, p21; see
also McCullagh, 1986). Thus official unemployment figures are
claimant based and are likely to be lower than the proportion
'out of work' as measured by the census. Alternatively, Eversley
(1989) calculates unemployment as the proportion of potential
employees out of work (ie excluding self-employed). For present
purposes then, the absolute level of 'unemployment' is of less
significance than the comparative levels of different groups.
With that background, the most significant point here is that
the unemployment rate in Northern Ireland has been consistently
higher than that of Great Britain (see section 8): for example,
on March 9, 1989, the official unemployment rate for men and women
in Northern Ireland was 19.3% and 10.3% respectively, while the
rates for the North of England were 13.4% and 6.7% respectively
and for East Anglia they were 4.1% and 3.2% (Employment Gazette,
May 1989, Volume 97, No.5): this is discussed in more detail in
section eight. Economically active population
In addition to the changing profile of industries and increased
proportions out of work, the census data point to a change in
the nature of the economically active population over time. Thus
in 1961 the number of economically active men was a little over
415,000 while that of women was a little over 187,000. However
while the number of economically active men declined over the
following censuses (403,000 in 1971), that of women increased
(200,500 in 1971). This pattern of women forming a increasing
proportion of the economically active population appeared to continue
in 1981 (398,500 men and 231,500 women) although it should be
noted that an unknown, but significant, number of people were
not enumerated in the 1981 census due to political protests linked
to hunger-strikes by Republican prisoners (see PPRU, 1981, Eversley
and Herr, 1985, and Compton and Power, 1986, for estimates on
missing census data).
Eversley (1989) pointed out that an increasing proportion of economically
active women is a common feature of societies which have seen
a shift from manufacturing to service employment. More specifically
it may be linked to an increase in part-time work in service industries.
Thus, in 1981 only 2.6% of employed men were in part-time work,
compared with 28.2% of all employed women and 41.1% of employed
married women (Tables A3.4 (a) and (b): Eversley, 1989)
To summarise to this point, the census data allow for the identification
of a number of broad trends in the economic structure of Northern
Ireland. Firstly, there has been a long term decline in the proportion
of the working population employed in agriculture and fisheries.
Secondly, there has been a more recent decline in the proportion
employed in manufacturing and extractive industries, particularly
the former. Thirdly, there has been an increase in the size of
the services sector. The pattern of change for the manufacturing
and services sectors is particularly marked for women. Fourthly,
there has been an increasing proportion of women in the economically
active population and this can be partly accounted for by an increase
in part-time employment in service industries. DEMOGRAPHIC FACTORS
In his detailed examination of the relationship between unemployment
and religion in Northern Ireland, Eversley (1989) described some
of the demographic features that have influenced the nature and
development of the labour market (see also, Compton and Coward,
1989, and section 9). Eversley points out that the age structure
of the Northern Ireland population differs somewhat from that
of other west European societies: there are proportionately more
young people and fewer middle-aged people in Northern Ireland
(see for example, table 2.1). Whereas in England/Wales there were
equal proportions of men and women in the 45-54 age group in 1981,
in Northern Ireland there was 8.4% more women.
Northern Ireland and England/Wales (1981) in percentages
(Source: Eversley, 1989, Pps. 19-25) The fertility rate in Northern Ireland was high until the mid-1960s but has gradually declined since that time. Within this overall pattern, the Catholic fertility rate has been, and remains, higher than the Protestant rate although currently this is at a lower level of childbearing. Also, both Catholic and Protestant rates are higher than the overall fertility rate for the United Kingdom, but lower than the rate for the Irish Republic (Eversley, Pp. 47-55). The age structure of the Northern Ireland population can be partly explained by the fertility rate, although an additional important feature has been the extent of out-migration, particularly among young and young middle-aged men and women. However, in recent years the level of out-migration has dropped because of general economic stagnation and reduced employment opportunities in Britain, Southern Ireland and overseas: thus, Eversley estimates the number of out-migrants to have dropped from about 12,500 in 1972-3 to a little under 5,500 in 1982-3 (Eversley, p35). Eversley concludes that the consequence of the age structure of Northern Ireland's population is that there are more entrants to the labour market than retirees from it. Thus there is an 'in-built momentum for growth' in the population which, if demand is not met, will result in higher levels of unemployment. This in-built momentum for growth can be ameliorated in three ways: firstly, the labour market might grow to absorb the increasing numbers of entrants; secondly, demand would decrease if the school leaving age is raised; and thirdly, demand can be siphoned off though out-migration. In the past, Eversley suggests, out-migration has played a particularly important role in this process. Insofar as the increased demand for employment is not met then unemployment can be expected to rise. This overall picture is complicated a little by the differential impact of these demographic factors on districts within Northern Ireland. For example, in 1981 the number of births per 1,000 population varied from a low of 10.0, in Castlereagh, to 24.0, in Derry (Eversley, 1989: p53). Eversley suggests that the significance of this is that unemployment is likely to be highly differentiated within regions of Northern Ireland if there are barriers to internal mobility.
NOTES Economically active men by employment status and sector of employment (source: Census information)
Economically active women by employment status and sector of employment (source: Census information)
Data for figure 2.2: Females in employment by year and industry sector (percentages) (source: calculated from 1926, 1961, 1966, 1971 and 1981 censuses)
Data for figure 2.3: Economically active persons by gender, year and employment status (percentages) (source: calculated from 1926, 1961, 1966, 1971 and 1981 censuses)
Last Modified by Martin Melaugh : | ||||||||||||||||||||||||||||||||||||||||||||||||||||||||||||||||||||||||||||||||||||||||||||||||||||||||||||||||||||||||||||||||||||||||||||||||||||||||||||||||||||||||||||||||||||||||||||||||||||||||||||||||||||||||||||||||||||||||||||||||||||||||||||||||||


