Visualising the Conflict
Geographic Information Systems (GIS) Graphs
Graphs - List of Graph Sets |
This page contains a list, with details of the various formats, of the GIS graphs that have been produced as part of the AHRC Visualising the Conflict project. Some of the graphs directly supplement particular map sets, where this is the case a link is provided.
All graphs were prepared by Luke Kelleher, then a Research Associate (GIS) working with CAIN. Graphs were sized as large as possible using the available software, however, the best resolution was 72dpi. Three versions are available below. TIFF versions (A4 approx.; 72dpi). PDF versions based on TIFF file. L-JPG versions are low resolution JPEG images (A4 approx; 72dpi).
The graphs have been produced and made available with the permission of Land & Property Services under Delegated Authority from the Controller of HMSO, © Crown Copyright and database right 2010; Permit Number: 40209.
Users are free to download the graphs (and other information) for 'private study'; this includes use in student essays, dissertations, etc. The graphs can also be downloaded for other educational use, for example as part of a one-off PowerPoint presentations. The graphs should NOT be reproduced on any Web site. Commercial use, for example in academic journal articles, or books, or magazines, will require the permission of CAIN and Land & Property Services.
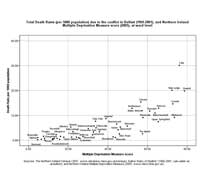 Graph Set 1:
Deaths and Killings (1969-2001), by area (Northern Ireland, Belfast, Derry), by status and organisation, at ward level
24 graphs
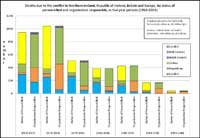 Graph Set 2:
Deaths and Killings (1969-2001), by area (Belfast, Derry), by status and organisation, with Multiple Deprivation Measure score, at ward level
4 graphs
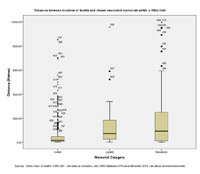 Graph Set 3:
Distances between locations of deaths and closest associated memorials within a 10km limit
2 graphs
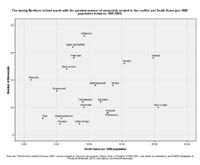 Graph Set 4:
The twenty Northern Ireland wards with the greatest number of memorials
2 graphs
| Graphs - Total Death Rates, by area (Belfast, Derry, highest 20 wards), and deprivation score, at ward level (24 graphs compiled and drawn by Luke Kelleher) |
| Title of Graph |
File Version |
| PDF
| L-JPG
|
TIF |
| Belfast |
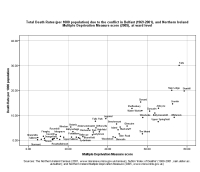 Deaths - MDM score - Belfast - Ward Deaths - MDM score - Belfast - Ward
Total Death Rates (per 1000 population) due to the conflict in Belfast (1969-2001), and Northern Ireland Multiple Deprivation Measure score (2005), at ward level |
.pdf
66kb |
.jpg
159kb |
.tif
1575kb |
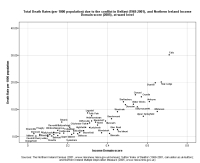 Deaths - Income score - Belfast - Ward Deaths - Income score - Belfast - Ward
Total Death Rates (per 1000 population) due to the conflict in Belfast (1969-2001), and Northern Ireland Income Domain score (2005), at ward level |
.pdf
62kb |
.jpg
154kb |
.tif
1624kb |
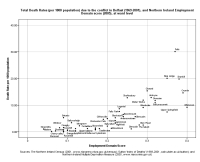 Deaths - Employment score - Belfast - Ward Deaths - Employment score - Belfast - Ward
Total Death Rates (per 1000 population) due to the conflict in Belfast (1969-2001), and Northern Ireland Employment Domain score (2005), at ward level |
.pdf
64kb |
.jpg
153kb |
.tif
1669kb |
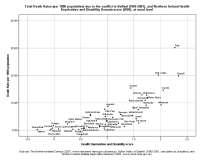 Deaths - Health score - Belfast - Ward Deaths - Health score - Belfast - Ward
Total Death Rates (per 1000 population) due to the conflict in Belfast (1969-2001), and Northern Ireland Health Deprivation and Disability Domain score (2005), at ward level |
.pdf
69kb |
.jpg
168kb |
.tif
1653kb |
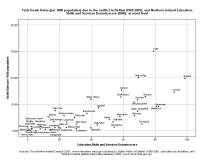 Deaths - Education score - Belfast - Ward Deaths - Education score - Belfast - Ward
Total Death Rates (per 1000 population) due to the conflict in Belfast (1969-2001), and Northern Ireland Education, Skills and Services Domain score (2005), at ward level |
.pdf
66kb |
.jpg
161kb |
.tif
1639kb |
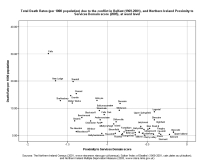 Deaths - Services score - Belfast - Ward Deaths - Services score - Belfast - Ward
Total Death Rates (per 1000 population) due to the conflict in Belfast (1969-2001), and Northern Ireland Proximity to Services Domain score (2005), at ward level |
.pdf
66kb |
.jpg
159kb |
.tif
1664kb |
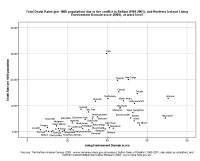 Deaths - Environment score - Belfast - Ward Deaths - Environment score - Belfast - Ward
Total Death Rates (per 1000 population) due to the conflict in Belfast (1969-2001), and Northern Ireland Living Environment Domain score (2005), at ward level |
.pdf
67kb |
.jpg
163kb |
.tif
1695kb |
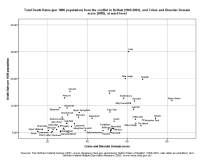 Deaths - Crime score - Belfast - Ward Deaths - Crime score - Belfast - Ward
Total Death Rates (per 1000 population) from the conflict in Belfast (1969-2001), and Crime and Disorder Domain score (2005), at ward level |
.pdf
65kb |
.jpg
157kb |
.tif
1702kb |
| Derry |
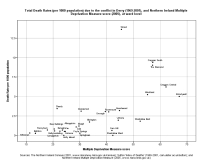 Deaths - MDM score - Derry - Ward Deaths - MDM score - Derry - Ward
Total Death Rates (per 1000 population) due to the conflict in Derry (1969-2001), and Northern Ireland Multiple Deprivation Measure score (2005), at ward level |
.pdf
63kb |
.jpg
152kb |
.tif
1707kb |
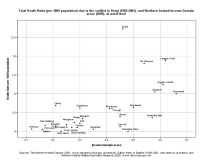 Deaths - Income score - Derry - Ward Deaths - Income score - Derry - Ward
Total Death Rates (per 1000 population) due to the conflict in Derry (1969-2001), and Northern Ireland Income Domain score (2005), at ward level |
.pdf
61kb |
.jpg
150kb |
.tif
1678kb |
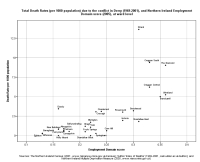 Deaths - Employment score - Derry - Ward Deaths - Employment score - Derry - Ward
Total Death Rates (per 1000 population) due to the conflict in Derry (1969-2001), and Northern Ireland Employment Domain score (2005), at ward level |
.pdf
62kb |
.jpg
152kb |
.tif
1678kb |
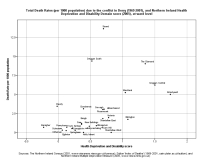 Deaths - Health score - Derry - Ward Deaths - Health score - Derry - Ward
Total Death Rates (per 1000 population) due to the conflict in Derry (1969-2001), and Northern Ireland Health Deprivation and Disability Domain score (2005), at ward level |
.pdf
62kb |
.jpg
148kb |
.tif
1682kb |
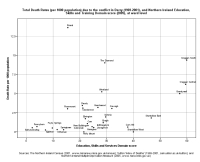 Deaths - Education score - Derry - Ward Deaths - Education score - Derry - Ward
Total Death Rates (per 1000 population) due to the conflict in Derry (1969-2001), and Northern Ireland Education, Skills and Services Domain score (2005), at ward level |
.pdf
63kb |
.jpg
153kb |
.tif
1671kb |
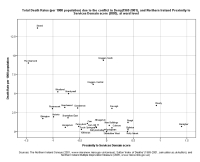 Deaths - Services score - Derry - Ward Deaths - Services score - Derry - Ward
Total Death Rates (per 1000 population) due to the conflict in Derry (1969-2001), and Northern Ireland Proximity to Services Domain score (2005), at ward level |
.pdf
60kb |
.jpg
148kb |
.tif
1696kb |
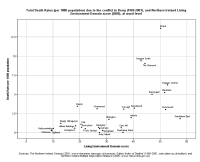 Deaths - Environment score - Derry - Ward Deaths - Environment score - Derry - Ward
Total Death Rates (per 1000 population) due to the conflict in Derry (1969-2001), and Northern Ireland Living Environment Domain score (2005), at ward level |
.pdf
60kb |
.jpg
147kb |
.tif
1696kb |
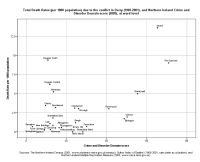 Deaths - Crime score - Derry - Ward Deaths - Crime score - Derry - Ward
Total Death Rates (per 1000 population) from the conflict in Derry (1969-2001), and Crime and Disorder Domain score (2005), at ward level |
.pdf
60kb |
.jpg
146kb |
.tif
1698kb |
| Highest 20 Wards |
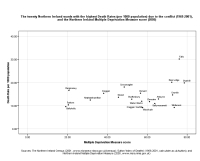 Deaths - MDM score - Top 20 Wards Deaths - MDM score - Top 20 Wards
The twenty Northern Ireland wards with the highest Death Rates (per 1000 population) due to the conflict (1969-2001), and the Northern Ireland Multiple Deprivation Measure score (2005) |
.pdf
54kb |
.jpg
136kb |
.tif
1732kb |
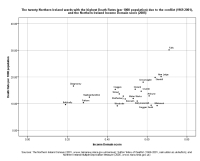 Deaths - Income score - Top 20 Wards Deaths - Income score - Top 20 Wards
The twenty Northern Ireland wards with the highest Death Rates (per 1000 population) due to the conflict (1969-2001), and the Northern Ireland Income Domain score (2005) |
.pdf
58kb |
.jpg
140kb |
.tif
1741kb |
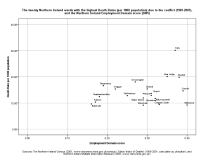 Deaths - Employment score - Top 20 Wards Deaths - Employment score - Top 20 Wards
The twenty Northern Ireland wards with the highest Death Rates (per 1000 population) due to the conflict (1969-2001), and the Northern Ireland Employment Domain score (2005) |
.pdf
56kb |
.jpg
138kb |
.tif
1768kb |
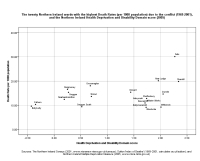 Deaths - Health score - Top 20 Wards Deaths - Health score - Top 20 Wards
The twenty Northern Ireland wards with the highest Death Rates (per 1000 population) due to the conflict (1969-2001), and the Northern Ireland Health Deprivation and Disability Domain score (2005) |
.pdf
59kb |
.jpg
145kb |
.tif
1750kb |
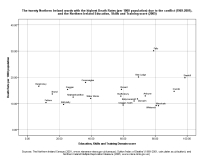 Deaths - Education score - Top 20 Wards Deaths - Education score - Top 20 Wards
The twenty Northern Ireland wards with the highest Death Rates (per 1000 population) due to the conflict (1969-2001), and the Northern Ireland Education, Skills and Training score (2005) |
.pdf
58kb |
.jpg
143kb |
.tif
1768kb |
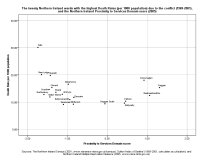 Deaths - Services score - Top 20 Wards Deaths - Services score - Top 20 Wards
The twenty Northern Ireland wards with the highest Death Rates (per 1000 population) due to the conflict (1969-2001), and the Northern Ireland Proximity to Services Domain score (2005) |
.pdf
60kb |
.jpg
140kb |
.tif
1696kb |
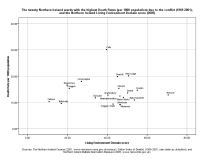 Deaths - Environment score - Top 20 Wards Deaths - Environment score - Top 20 Wards
The twenty Northern Ireland wards with the highest Death Rates (per 1000 population) due to the conflict (1969-2001), and the Northern Ireland Living Environment Domain score (2005) |
.pdf
60kb |
.jpg
147kb |
.tif
1759kb |
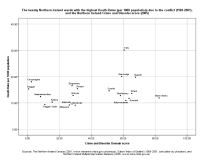 Deaths - Crime score - Top 20 Wards Deaths - Crime score - Top 20 Wards
The twenty Northern Ireland wards with the highest Death Rates (per 1000 population) due to the conflict (1969-2001), and the Northern Ireland Crime and Disorder score (2005) |
.pdf
58kb |
.jpg
142kb |
.tif
1759kb |
| Graphs - Deaths, by area (All countries, Northern Ireland, Belfast, Derry), by status and organisation, in five year periods (4 graphs compiled and drawn by Luke Kelleher) |
| Title of Graph |
File Version |
| PDF |
L-JPG |
H-JPG |
| Belfast |
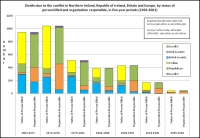 Deaths - Clustered - Five Year Periods - All Countries Deaths - Clustered - Five Year Periods - All Countries
Deaths due to the conflict in Northern Ireland, Republic of Ireland, Britain and Europe, by status of person killed and organisation responsible, in five year periods (1969-2001) |
.pdf
105kb |
.jpg
141kb |
.jpg
169kb |
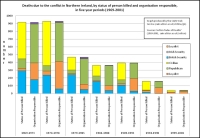 Deaths - Clustered - Five Year Periods - Northern Ireland Deaths - Clustered - Five Year Periods - Northern Ireland
Deaths due to the conflict in Northern Ireland, by status of person killed and organisation responsible, in five year periods (1969-2001) |
.pdf
107kb |
.jpg
142kb |
.jpg
173kb |
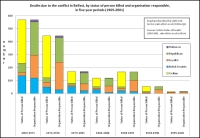 Deaths - Clustered - Five Year Periods - Belfast Deaths - Clustered - Five Year Periods - Belfast
Deaths due to the conflict in Belfast, by status of person killed and organisation responsible, in five year periods (1969-2001) |
.pdf
100kb |
.jpg
134kb |
.jpg
161kb |
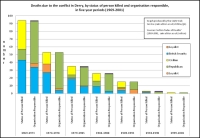 Deaths - Clustered - Five Year Periods - Derry Deaths - Clustered - Five Year Periods - Derry
Deaths due to the conflict in Derry, by status of person killed and organisation responsible, in five year periods (1969-2001) |
.pdf
101kb |
.jpg
133kb |
.jpg
161kb |
| Graphs - Distances between locations of deaths and closest associated memorials (2 graphs compiled and drawn by Luke Kelleher) |
| Title of Graph |
File Version |
| PDF |
L-JPG |
H-JPG |
| Northern Ireland |
 Distances Box plot - Deaths and Memorials - 10km limit Distances Box plot - Deaths and Memorials - 10km limit
Distances between locations of deaths and closest associated memorials within a 10km limit |
.pdf
52kb |
.jpg
90kb |
n/a |
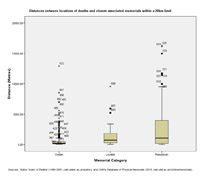 Distances Box plot - Deaths and Memorials - 20km limit Distances Box plot - Deaths and Memorials - 20km limit
Distances between locations of deaths and closest associated memorials within a 20km limit |
.pdf
47kb |
.jpg
83kb |
n/a |
Note: The above box plots are included to supplement the information contained in the deaths and memorials distance maps.
| Graphs - The twenty Northern Ireland wards with the greatest number of memorials (2 graphs compiled and drawn by Luke Kelleher) |
| Title of Graph |
File Version |
| PDF |
L-JPG |
H-JPG |
| Northern Ireland |
 Number of Memorials - Death Rates Number of Memorials - Death Rates
The twenty Northern Ireland wards with the greatest number of memorials related to the conflict and Death Rates (per 1000 population between 1969-2001) |
.pdf
56kb |
.jpg
97kb |
n/a |
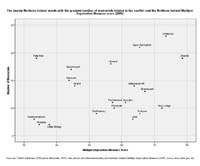 Number of Memorials - MDM Score Number of Memorials - MDM Score
The twenty Northern Ireland wards with the greatest number of memorials related to the conflict and the Northern Ireland Multiple Deprivation Measure score (2005) |
.pdf
55kb |
.jpg
96kb |
n/a |
|

