CAIN Web Service

Social Exclusion, Social Inclusion
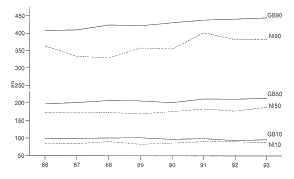
Patricia McKee The sectarian divide is the most serious and palpable threat to social cohesiveness in Northern Ireland, whereas in Britain there is much greater concern about economic inequality. While most observers would admit that economic issues play an important role in the conflict, attention focuses on their religious dimension: do Protestants/Catholics earn more? do they suffer higher unemployment? are they over/under-represented in the professions? and so on. Each community encompasses the spectrum of economic experience, from the long-term unemployed in the Shankill or Falls areas of Belfast to the rich entrepreneur on the 'gold coast' of north Down. This section concentrates on inequality of income in Northern Ireland. It is well known that income inequality increased sharply in the United Kingdom during the 80s. What has happened in this region? Answers can be found in the Family Expenditure Survey (FES), which covers some 600 households every year. Respondents tend, however, to underestimate their income; declared expenditure in fact provides a more reliable guide to it and is used in the following tables.[1] One way of assessing whether the poor have got poorer, or the rich richer, is to rank each person in such a survey by their income each year and then to watch the behaviour of the ranked responses over time. Following the extremes-the poorest and richest respondents - would bring sharp fluctuations. A clearer pattern would follow observing respondents with 10 per cent of those surveyed below their income (the poor), those with 50 per cent above and below (middling), and those with 90 per cent below (the rich). These are known as the 10th, 50th and 90th percentiles. Figure 1 charts the 10th, 50th and 90th percentiles of the FES sample for Northern Ireland and Britain. The most obvious point is that Northern Ireland is less well off: the 50th percentile (or median) weekly income in the region in 1990 was £177, compared to £201 in Britain. The difference for those on low incomes (the 10th percentile) - £87 in Northern Ireland against £98 in Britain - was smaller, as would be expected with common benefit rates. For the rich, by contrast (the 90th percentile), a weekly income of £356 in Northern Ireland compared to £430 in Britain.
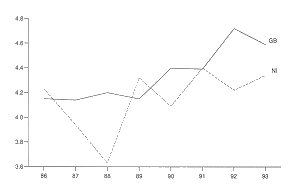
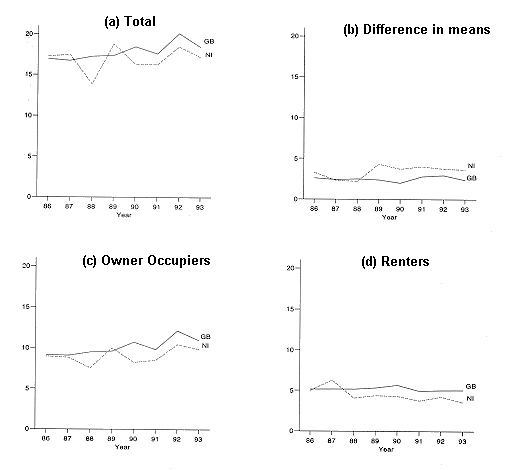
As to the pattern over time, Figure 1 also shows that the rich in Northern Ireland have indeed become richer, at a rate similar to their counterparts in Britain.[2] Thus, in 1987-93, in Northern Ireland the rich increased their weekly income from £334 to £384 - a £50 increase - while in Britain the corresponding rise was £410 to £445. On the other hand, the income of the region's poor has changed only marginally, rising from £85 a week to £88 - just £3 - in the same period; comparative figures for Britain are £99 and £97 respectively. A simple measure of inequality is the income of the 90th percentile divided by that of the 10th, as presented in Figure 2. In 1988 this ratio was 3.63 for Northern Ireland: the rich received over three and a half times the income of the poor. By 1993 this had increased to 4.34. This mirrored what was happening in Britain, where the ratio rose from 4.14 in 1987 to 4.72 in 1992. A more sophisticated index of inequality, called the 'mean logarithmic deviation',[3] is represented in Figure 3a. On the vertical scale, the higher the measure the greater the inequality. The index is actually usually slightly higher for Britain than Northern Ireland, indicating greater inequality there. One advantage of this index, however, is that it can be broken down according to social groups. Decomposing it by housing tenure gives a rough-and-ready representation of the role of social class-given the relative tendency of middle-class respondents to be owner-occupiers and of working-class respondents to be renters. Figures 3b and 3c show how much of the inequality set out in 3a can be explained by the inequality amongst owner-occupiers (3c) and that amongst renters (3d). What is left is contained in 3b: how much inequality there is between the two groups taken as a whole, when their mean (average) incomes are compared.
In 1989, the mean income of owner-occupiers in Northern Ireland was £261, compared with £140 for renters. The corresponding figures for Britain were £285 and £175 respectively - a smaller gap. Thus housing tenure makes a greater contribution to inequality in Northern Ireland, suggesting that class divisions are stronger in the region than in Britain.
Poverty and inequality are related but distinct concepts. The
most straightforward way of measuring poverty is to take an income - the
poverty line - considered the minimum required for an acceptable
standard of life and to find the proportion of the population
whose incomes fall below. But where should the line be drawn,
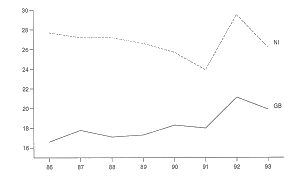
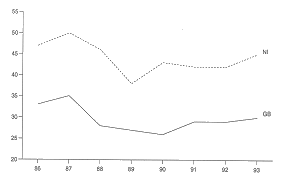
given living standards rise over time? One answer is to establish a relative poverty line, such as 50 per cent of mean UK income. In Britain this was £119 per week in 1986 and £128 in 1993. Other percentages could, of course, be chosen, but neither the extent of poverty in Northern Ireland, relative to Britain, nor its composition seem unduly sensitive to the precise level selected. By this standard, Figure 4 shows that the poor comprise a greater proportion of the population in Northern Ireland. In 1992, 30 per cent of people in the region were on incomes below 50 per cent of the UK mean, compared with 21 per cent in Britain. While this is hardly surprising, given the difference in mean weekly incomes (£220 and £256 respectively in that year), it means almost a third of people in Northern Ireland are below the poverty line, compared with a fifth in Britain.
As to who is poor, the most common family type of those
on low incomes in Northern Ireland is married with children, this
group accounting for between 38 per cent (1989) and 50 per cent
(1987) of poor households. As Figure 5 shows, this contrasts sharply
with the British experience, where the proportion varied between
a quarter and a third. The difference was made up by pensioners.
This can be seen more clearly when the poor are classified by economic status, as in Figure 6. The sample has been divided into eight categories by progressively removing the self-employed and the full-time and part-time employed, the various combinations of which take up five categories. This leaves three groups, the over-60s, the unemployed and a residual group, 'others', which is made up principally of long-term unemployed. These three groups dominate those who are poor.
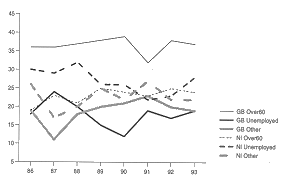 The over-60 category accounted generally for over one third of the poor in Britain, whereas in Northern Ireland the fraction varied between a fifth and a quarter. The position is reversed when we consider the unemployed. While unemployment in Northern Ireland achieved a minimum in 1990, its rate of 13 per cent was more than double that of the UK as a whole (5.8 per cent). Since then, the two areas have had disparate experiences; in the UK unemployment rose sharply to 10.3 per cent in 1993, whereas in Northern Ireland the increase in the same period was much more modest, to 13.9 per cent. Before 1990, the unemployment rate in Northern Ireland was 6-7 per cent above the UK average, so the greater proportion of families on low incomes classified as unemployed in the FES is not surprising. Despite major differences in incomes, the extent of inequality in Northern Ireland is not radically different from Britain, though there is some evidence of a more entrenched class structure. Both have experienced widening inequality in the past decade, with the rich becoming richer more rapidly than the remainder of society.
By a UK standard, however, poverty is greater in Northern Ireland
than in Britain. This is attributable to higher unemployment and
lower aggregate income, rather than to greater inequality within
the region. Footnotes

Democratic Dialogue {external_link} |


