Employment, Unemployment and Religion in Northern Ireland by A M Gallagher Section 9: Explaining the Unemployment Gap
INTRODUCTION A number of studies have examined the efficacy of possible explanations for the unemployment gap between the two communities (Osborne and Cormack, 1986; Doherty, 1981; Compton, 1981). More recently, in the period leading up to the passage of the 1989 Fair Employment Act, a series of research studies specifically addressed this issue (Smith, 1987a; Chambers, 1987; Smith, 1987b; Eversley, 1989). Although some of this evidence has been mentioned in previous sections of the review, this and the next section will examine this work specifically in relation to the question of unemployment. Among the explanations that have been offered for the higher level of unemployment among Catholics, in comparison with Protestants, are the following (see also, SACHR, 1987, Pps25-35):
Geographical factors:
Demographic factors:
Industrial factors:
Educational factors:
Indirect discrimination:
Direct discrimination:
Evidence on each of these suggested explanations will be examined
in turn. Before doing this it is worth pointing to one further
suggestion which was that Catholics did not have the same positive
attitudes to work as Protestants or, to put it another way, that
Catholics did not have the 'Protestant work ethic'. Miller (1978)
and McWhirter et al (1989) have presented evidence which suggests
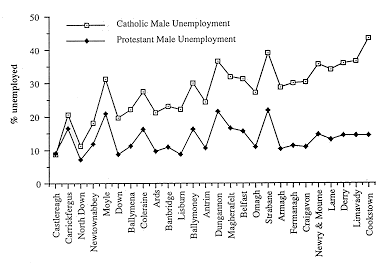
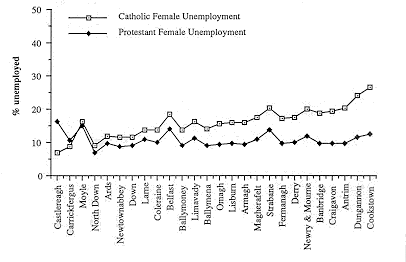
there is no substance to this view (see section four). Evidence examined in sections six and eight of this review confirmed that unemployment is unevenly spread throughout Northern Ireland and that the Catholics form a larger proportion of the population in areas where unemployment is highest. These areas are predominantly rural and are removed from the industrial hinterland of Belfast. However, if geographical factors are to explain aggregate differences in unemployment then it would be expected that Catholic and Protestant rates of unemployment would be similar in local areas. Osborne and Cormack (1986) examined Catholic and Protestant unemployment rates in each of the twenty-six district council areas using data from the 1981 census and their findings are displayed in figures 9.la and 9.1b, for men and women respectively. These figures showed that Catholic unemployment rates were higher in all but one of the District Council areas, for men, and in all but two District Council areas, for women.
More recent data on unemployment levels in the four Westminster
constituencies in Belfast presented in section eight highlighted
a similar pattern where the mainly Catholic constituency of Belfast
West had the highest proportion of the unemployed in comparison
with the other three Belfast constituencies.


This evidence suggests that geographical factors alone do not
account for the unemployment gap. It remains possible that geography
plays some explanatory role in combination with some other factors.
In contrast to all this discussion, Eversley (1989) has argued
that any geographical explanation of the unemployment gap is
irrelevant. Both of these aspects are considered further in
section ten.
The most recent evidence on fertility levels in Northern Ireland
showed that Catholic fertility has been and remains higher than
that of Protestants (Compton and Coward, 1989; see also, Eversley,
1989, Pp47-55). As described above, demography could explain
the unemployment gap in two ways: firstly, proportionately more
Catholics enter the labour market relative to their proportion
in the adult working population, thus exacerbating the impact
of unemployment on Catholics; and secondly, more Catholics may
be caught in the poverty trap thus encouraging more of them to
remain unemployed. Compton (1981: Ppl38-141) has argued most forcefully for the first of these explanations. He showed that if the rate of population increase in 1975/6 remained constant until the year 2000, then a little over twice as many Catholic men as Protestant men would reach an economically active age. He went on to show that even if Catholics and Protestants had an equal chance of finding employment, this would still result in a Catholic rate of male unemployment that was three times greater than that of Protestant men. This argument can be illustrated in the following way: let us assume there is a working population with a majority group (P) of 100 people and a minority group (C) of 50 people. Over a period of time let us assume that the population increases by 50, but these new entrants have only an 80% chance of obtaining employment: of these 50 new entrants 40 will be employed and 10 will be unemployed. If the fertility level of the minority group (C) is higher than that of the majority group (P), then the number of new entrants will be proportionately higher for C than P: in this case let us assume that of the 50 new entrants 20 are from P and 30 are from C. If all the new entrants have an 80% chance of getting a job, then of the 20 new entrants to P. 16 will get jobs; and of the 30 new entrants to C, 24 will get jobs. Thus the total populations of P and C will be 120 and 80 respectively, but 116 from P will have jobs and 74 from C will have jobs. Considered another way, of the 120 from P, 4 will be unemployed (3.3%), while of the 80 from C, 6 will be unemployed (7.5%). Thus, even though there was equal opportunity in obtaining employment, because the minority group (C) was increasing at a faster rate, the unemployment level in that group was over twice that of the majority group (P). While Compton's model presents a dramatic illustration of the impact of differential population growth on employment opportunity it has been challenged in a number of respects. Firstly Eversley (1989) has pointed out that growth rates have declined for both Protestant and Catholic populations in Northern Ireland. Thus, while the current Catholic rate remains higher than the Protestant rate, this is at a much lower overall level of childbirth: in other words, rates of increase are not static and are unlikely to remain static. Secondly, Compton's model relied on an assumption that unemployment was zero at the start and rose over the period examined. Smith (1 987) has pointed out that for the model to be accurate, it would also imply that in a period of falling unemployment, ie. unemployment high at the start and falling over the period examined, then Catholic unemployment would fall much faster than Protestant unemployment: in other words, if population was the only, or predominant factor, and Catholic population growth remained higher than that of Protestants, then Catholics would gain a disproportionate benefit in a situation of falling unemployment. There is no evidence that this has happened in Northern Ireland (although see section 11). Eversley (1989) has argued further that explanations based on differential fertility levels ignore the time-lag between birth and labour market entry: Those who attempt to make the connection seem to overlook that time lag between birth and labour market entry - a period which becomes longer as children stay longer in full-time education. The further we go back in the post-war evoultion of the Northern Irish population, the stroller the share of Catholics in both the child and the adult working age-groups; yet the excess unemployment was always there. This is another reason why it is not legitimate to blame Catholic fertility for the present heavy imbalance. (Eversley, 1989, p221).Perhaps the most significant criticism is that the model assumes that unemployment results from new entrants to the labour market thus ignoring the impact of labour turnover within the market. All models involve some degree of simplification of actual processes, but in this case the model may present an over-simplification of labour market processes. Osborne and Cormack (1989 Pp42-44) have pointed out, for example, that between 1971 and 1981 almost 90% of the net total labour force growth was accounted for by an increase in female economic activity rates. Alternatively, Gudgin et al. (1990) have provided a detailed examination of the wide range of processes involved in the labour market in relation to unemployment levels, including internal labour market mobility and movement in and out of Northern Ireland. The poverty trap An explanation based on the poverty-trap has been proposed by Doherty (1981: Ppl22-3). Doherty suggested that, of his sample of Belfast unemployed, almost a quarter fell into a category that was characterised by an average of three dependent children, a low level of skill and very low earnings potential while in employment. Furthermore, he suggested that the proportion of unemployed who received more while unemployed than while employed was higher in Belfast than in three comparable English towns. Although Doherty had no data on the religion of individual members of his sample, he suggested that the characteristics of those caught in the poverty-trap were more likely to be found among Catholics than Protestants. This, he suggested, "may help to account for some of the link between unemployment and Catholic religious affiliation" (pl23). A later study of a sample of unemployed men drawn from across Northern Ireland (Miller and Osborne) 1983: Pp86-87). which did identify individuals' religion, drew two conclusions which seemed to counter Doherty's suggestions. Firstly, Miller and Osborne showed that the proportion who received benefit close to previous earnings was rather small (less than 8%): in other words, only a small proportion of the unemployed seemed to fall within the danger-zone of the poverty trap. Secondly, Miller and Osborne found that of this group, a little over a fifth had five or more dependent children, while over a half had two or less dependent children. They concluded that the poverty-trap problem was more related to issues of low pay rather than large families.
On balance, therefore, it would appear that demographic factors
alone do not provide an adequate explanation for the unemployment
gap. Evidence examined in section eight of this review highlighted the differential impact of unemployment on different sectors of industry. Thus, figure 8.7 suggested that unemployment had an above average impact on the construction industry and a below average impact on manufacturing industry. Related to this, analyses of the 1971 census by Aunger and the FEA (see section three) and of the 1981 census by Cormack and Osborne (see section seven) pointed to the link between religion and industrial sector such that Catholics were more likely to be found in low-status industries. The construction industry, for example, had the greatest extent of Catholic over-representation, while Protestants were over-represented in the high-status engineering industry located in and around Belfast. Furthermore, opportunities in the teaching profession, one of the traditional routes to advancement for Catholics, has been effected by falling pupils enrollments (Gallagher, 1989). A further feature of Cormack and Osborne's analysis of the 1981 census suggested another important element. Their disaggregation of occupational status by age suggested that among 16-35 year olds, Protestants were able to compensate, to some degree, for rising unemployment by gaining employment in security related occupations (see section 7, especially figures 7.5, 7.6 and 7.7). For a variety of reasons Catholics were largely unable or unwilling to avail of these opportunities (see SACHR, 1987, p34).
The emergent picture from this evidence is that industrial factors
may go some way to explain the unemployment gap between the two
communities given that there is evidence of differential participation
of the communities in different industrial sectors. Of course
this raises the further question as to why this differential participation
has occurred and why it is being maintained? Is it because fewer
Catholics have the skills and training required to enter occupations
in these industrial sectors, or are there other barriers to their
participation? A great deal of evidence exists on outputs from the education system in Northern Ireland (see section four). Broadly speaking the patterns identified can be summarised thus: leavers from Protestant schools have better qualifications and are more likely to enter employment than leavers from Catholic schools. Two contrasting patterns are that proportionately more leavers from Catholic schools have no formal qualifications while proportionately more pupils in Catholic schools remain in education beyond the compulsory age. Finally, there are curriculum differences such that pupils in Protestant schools are more likely to take science and technology subjects for examination, while pupils in Catholic schools are more likely to take humanities subjects. These patterns would seem to imply some mediating role for educational processes in employment opportunity. However, Murray and Osborne have pointed out that such links are by no means direct. Cormack et al. (1980) and Murray and Darby (1980), for example, suggested that factors other than simply qualifications mediated entry to employment. Also, Cooper (1981) has pointed out that, at least in the past, Catholics did not fare well in the civil service, where qualifications in humanities subjects ought to have been a benefit. Evidence on graduate employment (Miller at al., 1990: see section four) suggests that religious differences in employment level can be linked to the degree subject taken, which in turn can be linked to curriculum differences between Protestant and Catholic schools. It should be noted, however, that this evidence deals with a narrow sector of the labour market and with employment level achieved rather than unemployment per se.
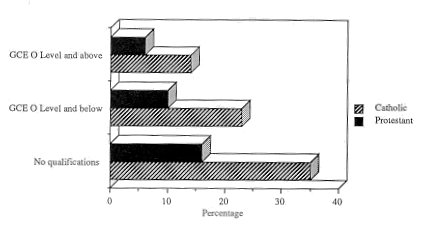
The most recent CHS data suggests that higher rates of Catholic
unemployment are found even with some account taken for level
of qualification (see figure 9.2) although these data cover a
very wide age-range and so might disguise different patterns among
more recent entrants to the labour market. Until relatively recently
the proportion of school leavers with no qualifications was very
high. This, allied with high unemployment in the 1980s, might
have heightened the link between qualifications and employment
for younger age groups, the 'tightening bond' hypothesis.

Following a detailed examination of the most recent evidence (excluding that on graduate employment), Eversley (1989) concluded that, while religious differences in educational performance and opportunity remained, they did not seem adequate to explain the difference in job opportunities (pl94). Furthermore, as was pointed out in section four, the Education Reform (Northern Ireland) Order 1989 will lead to a common core curriculum in all schools which should reduce still further the curriculum differences that currently exist between the school systems, albeit over a period of time.
The factors considered so far, then, either do not in themselves
appear to adequately explain the unemployment gap, or raise further
questions as to why the factor has had an impact. There remains
the possibility that some combination of these factors may explain
the gap. A second possibility is that some of these factors, in
combination with processes of discrimination, may explain the
unemployment gap, or alternatively, that processes of discrimination
alone may provide a sufficient explanation. These issues have
provided the focus for the most recent studies on employment in
Northern Ireland and will be examined in section ten.
NOTES
Data for figure 9.2: Percentage unemployed by educational qualification
CHS 1985-7
(source: PPRU Monitor 1/89, table 4.2)
| |||||||||||||||||