Employment, Unemployment and Religion in Northern Ireland by A M Gallagher
INTRODUCTION In 1987 a Fair Employment Agency research report provided an analysis of religion and employment in the 1981 census (Osborne and Cormack, 1987; see also Fair Employment Agency, 1988). The report sought to examine the extent to which the 1981 census patterns revealed change or continuity compared with the 1971 census (see section three). Unfortunately only a limited comparison of the two census datasets was possible because of changes in the classification systems. In addition, there was a higher non-response to the voluntary question on religious affiliation in 1981, compared with 1971, and a significant, but unknown, rate of non-enumeration due to political protests surrounding the hunger-strike of Republican prisoners (Eversley and Herr, 1985; Compton, 1986). Osborne and Cormack's analysis of the 1981 census data covered three broad areas: firstly, they examined evidence on the religious patterns of employment status; secondly they examined the industrial profiles of the two communities, ie the relative proportions of Protestants and Catholics in different types of industries; and thirdly they examined the occupational profiles of the two communities, ie the proportions of Protestants and Catholics in different occupational groups. Each of these areas linked into Aunger's analysis of the 1971 census which found that Protestants dominated the upper occupational classes, the religious groups were partially segregated by industry such that Protestants dominated the higher status industries, and within the same occupational category Protestants tended to dominate positions of authority (see section three). This section relies heavily on Osborne and Cormack's analysis, with some additional information extracted from the census for the purpose of illustration.
An examination of employment status can focus on a number of distinct areas. Included among these are the proportions in managerial and supervisory positions, the self-employed, the seventeen socio-economic categories used in the 1981 census and the broader social class categories. Evidence on the proportions of Protestants and Catholics in each of these areas will be examined below.
It was possible to compare the proportions of Protestants and Catholics in managerial and supervisory positions for both the 1971 and 1981 censuses. Osborne and Cormack found a gender and religious pattern for both census years such that men were more likely than women, and Protestants were more likely than Catholics, to be in managerial and supervisory positions. In 1981, for example, 9.4% of employed men were in managerial positions compared with 3.1% of employed women.
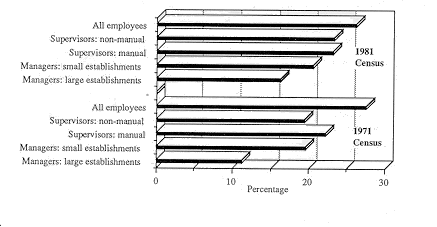
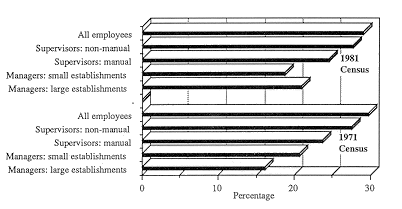
The religious difference is illustrated in figures 7.1(a) and (b) which show the proportions of Catholics among managers (in large and small establishments) and supervisors (manual and non-manual) for men and women separately. Figures from the 1971 and 1981 censuses are included for comparison, while the Catholic proportion of all employees provides a baseline measure. (On figures 7.1(a), 7.1(b), 7.2(a) and 7.2(b) the proportions are based on the total number of Catholics and Protestants only, ie 'not stated' are excluded). The figures illustrate the general under-representation of Catholics among managerial and supervisory positions and show that this is most marked among managers in large establishments. However the figures point to some improvement in the position of Catholics between the two census years. In 1981 Catholics remained under-represented in managerial and supervisory positions, in comparison with their proportion of employees overall, but the gap between Protestants and Catholics was generally narrower than had been the case in 1971.
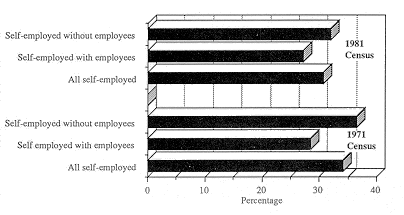
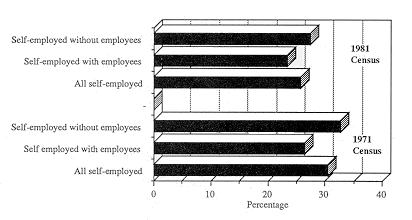
The total number of self-employed persons fell between the 1971 and 1981 censuses: the number of self-employed men fell from 68,355 in 1971 to 52,596 in 1981, while the number of self-employed women fell from 9,472 to 5,087. It seems likely that this decline could be largely explained by the oncoming recession in 1981 rather than under-enumeration in the 1981 census. These data show also that men are much more likely to be self-employed compared with women. Figures 7.2(a) and (b) show the proportion of Catholics among the self-employed for men and women separately. The self-employed with employees would, in general, own larger concerns. The first point to note from the figures is the proportion of Catholics among the self-employed: in all categories the Catholic proportion hovers between a quarter and a third of the self-employed and this approximates the Catholic proportion of the economically active population overall. This may be explained by the provision of certain services and facilities in locally segregated communities.
However, there is a religious difference between the self-employed with and without employees: Catholics are slightly under-represented among the larger concerns, ie self-employed with employees, and this is true for men and women. Comparing the proportions for 1971 and 1981 suggests that self-employment among Catholics declined in all categories and for both sexes, although on the available information it is not possible to offer any explanation for this pattern.
Osborne and Cormack examined the social class distributions of
the two communities by comparing the proportions found within
each of the six social class categories (professional, intermediate,
skilled non-manual, skilled manual, semi-skilled and unskilled).
In addition they included a seventh category of unemployed. Since
changes in the categorisation system between 1971 and 1981 meant
that a direct comparison of the social class distributions of
both censuses was not possible, they attempted to assess change
by comparing the distributions of people aged between 16 and 35
years with those aged 36 years and over.
gender, religion and age, 1981 (in percentages) (source: Osborne and Cormack, 1987, Pps26-27).
When the unemployed were excluded from the analysis it was found that the social class distributions of the two groups were quite similar, as is illustrated by figure 7.4: for men the main differences were in the higher proportion of Protestants in the skilled non-manual category (14% vs. 10%) and the higher proportion of Catholics in the unskilled category (8% vs. 6%). For women there were a higher proportion of Catholics in the intermediate (29% vs. 22%) and semi-skilled categories (27% vs. 24%), and a higher proportion of Protestants in the skilled non-manual category (39% vs. 30%).
(excluding unemployed) 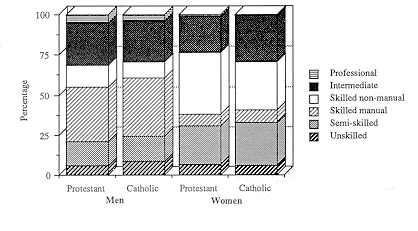 In order to assess the extent of change over time Osborne and Cormack compared the social class distributions of those aged 36 years and over with those aged between 16-35 years. Table 7.1 illustrates the proportions employed in non-manual and manual categories. The majority of men were in manual occupations as were a higher proportion of the younger men and Catholic men. For all men, therefore, a higher proportion of the Protestants were in higher status non-manual occupations. Comparison by age and religion suggests that this level of Protestant advantage increased over time, as the 'gap' in non-manual occupations favouring Protestants was higher for the younger age-group than for the older group. The position of women was somewhat different. The main difference was the much higher proportion of women who worked in non-manual occupations, particularly among the younger age-group. In addition there was little difference in the distributions for Protestants and Catholics: while the proportion of Catholics in non-manual occupations was slightly higher for the older age group, the reverse was true for the younger age group. Overall Osborne and Cormack highlighted four main points from their examination of the social class distributions of the two groups: Firstly, unemployment existed to a much greater extent among Catholics and provided the main difference in the social class distributions of the two communities. Secondly, the social class distributions suggested that women were disadvantaged compared with men and, that within this pattern of female disadvantage, the 'gap between Protestant and Catholic women was less than that between Protestant and Catholic men. Thirdly, among employed men a larger proportion of Protestants than Catholics were in non-manual employment and this differential was greater for the younger age-group. Finally, among employed women only a slight difference was found in the proportions of Protestants and Catholics in non-manual employment.
The broad picture of continuing Catholic disadvantage gained from an examination of social class distributions was confirmed by an examination of the proportions of Protestants and Catholics within the seventeen socioeconomic groups identified in the 1981 census. Osborne and Cormack concluded that Protestants were over-represented in the higher status groups, compared with their proportion in the population. Thus Protestant men were over-represented in the managerial and supervisory categories, and among farmers of large units and members of the armed services. By contrast, Catholics were over-represented among personal service workers, unskilled manual workers and own account workers (not professional). For women the largest extent of Protestant over-representation was among managers of large establishments, farmers of large units and members of the armed services, while for Catholic women it was ancillary workers and artists (intermediate non-manual). It should be noted also that Catholic men and women were over-represented among the category of 'inadequately described or not stated occupations'.
The 1981 census categorised people into ten industrial orders,
determined by the area of industry within which they worked. Among
men the main areas of difference identified by Osborne and Cormack
were the Protestant over-representation in high status manufacturing
industry (metal goods, engineering and vehicle industries) and
the Catholic over-representation in construction, usually considered
as a low status industrial order. Examination of sub-divisions
suggested that for both groups of men five sub-divisions accounted
for almost a half of total employment, and these sub-divisions
highlighted the increased role of the state in recent years (see
table 7.2).
(source: Osborne and Cormack, 1987, Pps 42-3)
For Catholic men the highest sub-division was construction, an area that had benefitted from an influx of public funds and public sector employment, while the highest sub-division for Protestant men was public administration, national defence and social security, all directly linked to public sector employment. Of the five most significant sub-divisions for both groups four were common to Protestants and Catholics, with only education (significant for Catholics) and manufacture of other transport equipment (significant for Protestants) differing. The main characteristic of female industrial distributions was the heavy concentration, for both Protestants and Catholics, in 'other manufacturing industries', 'distribution, hotels and catering; repairs' , and 'other services', particularly the last of these. Protestant women were over-represented in 'distribution, hotels and catering; repairs' while Catholics were over-represented in 'other services'. Overall, however, the differences are less marked than among men, women generally were concentrated in service employment and a high proportion were engaged in part-time work.
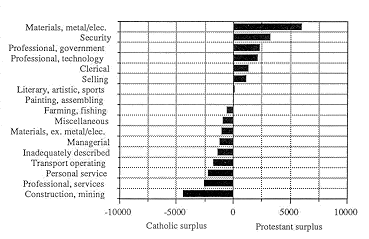
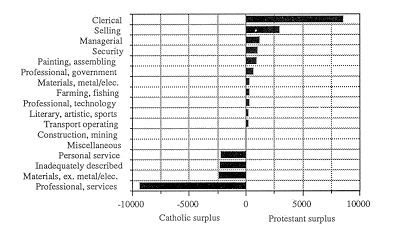
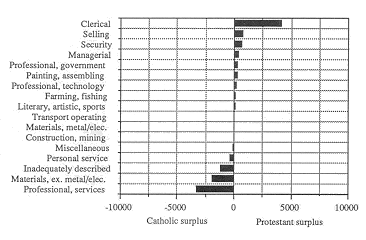
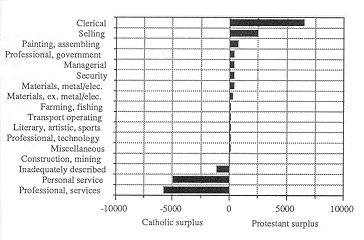
The 1981 census described seventeen occupational orders, categorising people by the type of occupation they followed. Osborne and Cormack examined the occupational profiles of the two groups and attempted to assess change using two age cohorts: those aged 16-35 years and those aged 36 years and over. Their conclusions are illustrated on a series of figures. In each case the number of Catholics in each occupational order has been recalculated as if the total number of Catholics was equal to the total number of Protestants. With these weighted data each figure illustrates the differential representation of Protestants and Catholics in each occupational order.
Figure 7.5 shows the comparative representation of Protestant and Catholic men: bars to the right of the centre line indicate over-representation of Protestants while bars to the left of the centre line indicate over-representation of Catholics. Figure 7.5 shows that the main areas of Protestant over-representation were security and protective services (order 8), and metal and electrical materials processing (order 12: skilled manual occupations mainly in engineering).
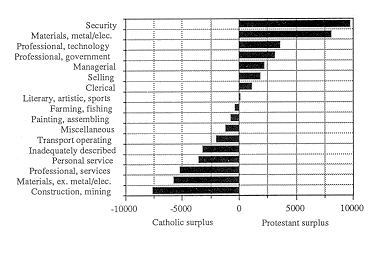
The main areas of Catholic over-representation were construction (order 14), non-metal and electrical materials processing (order 11: a range of skilled manual occupations outside the engineering sector) and professional occupations in education, welfare and health (order 2: here relating mainly to teachers). In addition to the above patterns, Osborne and Cormack noted the Protestant over-representation in other occupational groups which were numerically small but which included "key occupations in administrative and commercial life in Northern Ireland" (11th FEA Annual Report p104) . These included professionals in science, engineering and technology (order 4), and professional and related supporting management (order 1), a category which included senior managers in local and national government.
Disaggregation by age (see figures 7.6 and 7.7) indicated that the two main areas of Protestant over-representation (ie orders 8 and 12) remained the same. However, the extent of over-representation was greater in security and protective services (order 8) for the younger cohort (aged 16-35 years) while for the older cohort (aged 36 years and over) the category of skilled manual occupations in engineering (order 12) was more significant.
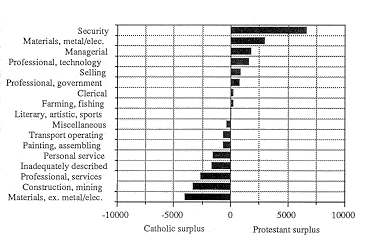
Of the main areas of Catholic over-representation construction
(order 14) and teaching (order 2) were important for both cohorts,
with construction being more significant for the older cohort.
The third main area of skilled manual occupations outside the
engineering sector (order 11) was a significant area of Catholic
over-representation for the younger cohort only.
Figure 7.8 shows the pattern of occupational difference for women. The figure shows that the main area of Protestant over-representation was clerical occupations (order 6), while the main area of Catholic over-representation was professional occupations in education, welfare and health (order 2: here referring mainly to nurses and teachers).
Figures 7.9 and 7.10 show the patterns for women aged 16-35 years
and aged 36 years and over, thus permitting an examination of
change over time. These figures suggest that Protestant over-representation
in clerical occupations (order 6) was common to both age cohorts
but that amongst the older cohort an additional area of over-representation
was found in selling (order 7: mainly shop workers): this was
probably related to an increase in part-time employment in this
occupational category. Teaching and nursing (order 2) provided
the main area of Catholic over-representation for both cohorts.
However, domestic and other personal service occupations (order
9) provided the next most significant area of Catholic over-representation
for the older cohort, while non-metal and electrical materials
processing (order 11: textile and clothing occupations) provided
the next most significant area of Catholic over-representation
for the younger cohort.
Given the importance overall of professional occupations in education, welfare and health to Catholics, Osborne and Cormack noted their concentration in teaching and nursing occupations. Within this category of occupations Catholics were, however, less well represented in the higher status occupations of doctors, pharmacists, dentists and teachers in higher education.
Aunger's analysis of the 1971 Census had suggested that: (a) Protestants dominated the upper occupational classes while Catholics were predominantly found in the lower classes; (b) the religious groups were partially segregated by industry such that Protestants dominated the higher status industries while Catholics were concentrated in low status industries; and, (c) within the same occupational category Protestants tended to dominate positions of authority. A direct comparison between Aunger's analysis of the 1971 Census and the 1981 Census was not possible. Also, the occupational context has changed over the 1970s with a fall in manufacturing employment, a rise in service employment (including part-time work) and a dramatic rise in unemployment. Nevertheless it is possible to draw some connections between the analyses of the 1971 and 1981 censuses. Firstly, in the 1981 Census there was evidence of some improvement in the broad socio-economic position of Catholics in that the gap between Protestants and Catholics narrowed at the upper levels. In addition, the socio-economic profiles of Protestants and Catholics in employment appeared to be broadly similar. However, unemployment has had a greater impact on the Catholic community to the extent that the much higher rate of unemployment among Catholics represented the main socio-economic difference between the two communities. Secondly, Protestants continued to dominate the high status occupational groups. Thirdly, although the industrial profile of the entire population changed quite considerably in the decade between 1971 and 1981, Protestants remained over-represented in the high status manufacturing industries while Catholics remained over-represented in the low status construction industry. It appeared that a large increase in security related employment ameliorated the impact on Protestant men, in particular, of the decline in manufacturing employment. Fourthly, there was continuing evidence that within the same occupational category Protestants tended to dominate higher status positions.
Finally, there remained important gender differences in occupational
and industrial profiles to the disadvantage of women. Given the
focus of the present review on religious differences these gender
differences have not been considered in detail. For the present
purposes their main significance is that differences in the occupational
and industrial profiles of Protestants and Catholics were most
marked for men. Assessing the overall patterns revealed by their analysis, Osborne and Cormack suggested that: "The balance sheet between continuity and change in the employment patterns of Protestants and Catholics from the early 1970s to the early 1980s is weighted towards continuity mainly by the large scale difference in unemployment. Some areas of improvement and change are identifiable for those in employment and should not be ignored or underestimated but viewing the total picture suggests that a substantial task remains to secure full equality of opportunity" (Osborne and Cormack, 1987, Pp 104-105).
Although a comparable detailed analysis of the employment experiences of both communities will not be possible until the 1991 Census has been collected, it is possible to obtain some information using data collected by the Continuous Household Survey (CHS). The most detailed analysis available to date is that provided by Smith (1987a) using CHS data from 1983-85. Most of Smith's analysis relates to the unemployed population, although a section of this report examines religious differences among the employed population. Most of the patterns identified by Smith confirm those found by Osborne and Cormack (1987), so only a few comments on additional features identified by Smith will be examined here. Smith found that within each age-group a higher proportion of Protestants than of Catholics were working. This suggested that Protestant families were more likely than Catholic families to have a wage-earner. Because this pattern was true for men and women, Protestant families were also more likely to have a second wage-earner than Catholic families (p61). In addition, Protestant men were more likely than Catholic men to receive earnings from overtime work (p70). All of these factors, in combination with the higher average family size among Catholics, suggested that the standard of living was higher for Protestant families. This was confirmed by an examination of the number of consumer durables in Protestant and Catholic households (p71). Protestant men had jobs at higher levels than Catholic men, although this tendency was not strong and Catholic men were well represented within skilled manual and intermediate non-manual jobs (p62). Smith argued that his analysis did not suggest that differences in qualifications among Protestants and Catholics explained this tendency (Pp63-7).
One particularly important factor Smith looked at was the extent
of job-changing among men and women. He found that men changed
jobs, on average, once every three years, while women changed
jobs, on average, once every four years (Pp70-1). This significance
of this is to illustrate the dynamic nature of the labour market
with a fairly high level of internal movement. This, Smith argued,
provided considerable scope for changing the overall pattern of
employment through, for example, equal opportunity measures.
Data for figure 7.1: Managerial and supervisory positions by
religious affiliation and gender 1971 and 1981 (percentages)
figures 7.5 to 7.10 are based on wieghted data calculated from
tables 8 and 9 in Osborne and Cormack, 1987 (Pp49-50)
| ||||||||||||||||||||||||||||||||||||||||||||||||||||||||||||||||||||||||||||||||||||||||||||||||||||||||||||||||||||||||||||||||||||||||||||||||||||||||||||||||||||||||||||||||||||||||||||||||||||||||||||||||||||||||||||||||||||||||||||||||||||||||||||||||||||||||||||||||||||||||||||||||||||||||||||||||||||||||||||||||||||||||||||||||||||||||||||||
