SECTION THREE: THE 1971 CENSUS INTRODUCTION The 1971 Northern Ireland Census was the first to publish information on occupational levels disaggregated by religion, thus providing the first opportunity since the 1901 Census of Ireland to gain an overall picture of the relationship between religion and employment. Prior to this the issue of discrimination in employment was subject to polemic exchanges between nationalists and unionists (see Whyte, 1983, p1) and examinable only with partial statistics (for reviews of the evidence see Darby, 1976; Whyte, 1983). Gallagher (1957) examined local council employment in the 1950s and claimed that although Catholics had a proportionate share of jobs overall, they tended to be over-represented in the lower grades. In a similar vein Barrit and Carter (1962) suggested that few Catholics were employed in the higher levels of the civil service, while the Campaign for Social Justice (1972) (see also, Whyte, 1986; McCluskey, 1989; Purdy, 1990) claimed that, in the 1960s, Catholics were under-represented on public bodies and in employment in public utilities (see also Boehringer, 1971; Donnison, 1973). Historians have found evidence of what appear to be discriminatory practices within government ministries as state papers become available for inspection (Buckland, 1980; Bew, Gibbon and Patterson, 1980; Whyte, 1988). In contrast to this was the evidence of two surveys: Budge and O'Leary (1973), in a survey of Belfast, concluded that the occupational structure of Protestants and Catholics was broadly similar; Rose (1971), in a province-wide survey of social attitudes, found only slight economic differences between the two communities. Reviewing this evidence Whyte (1983) suggested that most complaints were directed at Unionist controlled local authorities in the West of the Province, ie the area where Catholics formed a majority of the population. The 'order of demerit' following this was other local authorities, the Northern Ireland civil service and the Westminster civil service (Whyte, 1983, p14). Whyte also pointed out that relatively little data were available on public employment. An alternative view is provided by Hewitt (1986) and Kingsley (1989) who argue that claims of discrimination were largely overstated. Two analyses of the 1971 Census will be described in the remainder of this section. Aunger (1975; 1983) examined the occupational structure of the two communities in Northern Ireland, while a report of the Fair Employment Agency (FEA, 1978) examined the industrial structure of the two communities. The findings of both reports will be examined in some detail as they provide the baseline against which later developments in fair employment were to be assessed. In the Census tables the occupational orders categorise people on the basis of the type of work they do, regardless of where they do the work; the industrial orders categorise people in similar areas of employment. As was stated above, the 1971 Census provided the first opportunity to carry out such a comprehensive examination of the relationship between religion and employment in Northern Ireland.
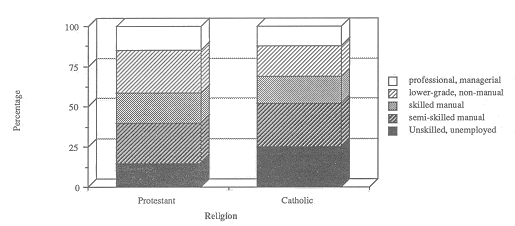
Aunger (1975, 1983) was interested in the occupational structure of the two communities since it had been argued that they were stratified in similar ways. If this were true, suggested Aunger, it raised a question about the absence of class-based organisations containing both Protestants and Catholics. Alternatively, if the two religious communities were stratified in different ways, this in itself might explain the absence of class-based organisations. Aunger categorised the census occupations into five groups, professional and managerial, lower grade non-manual, skilled manual, semi-skilled manual, and unskilled and unemployed. Figure 3.1 indicates the population proportions in each category and the stratification of the Protestant and Catholic populations.
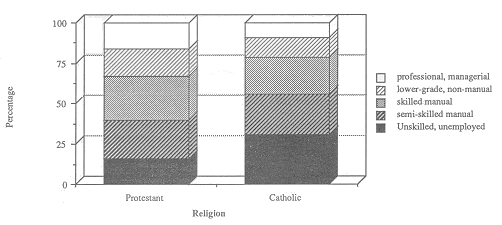
 Aunger concluded that Protestants were over-represented in the non-manual and skilled manual categories, while Catholics were over-represented in the semiskilled and unskilled/unemployed categories. He noted that the median Protestant was a skilled manual worker, while the median Catholic was a semi-skilled manual worker. While figure 3.1 relates to data for both men and women, Aunger pointed out that the trends were enhanced when the data for men only were examined (figure 3.2). Thus, the modal category among Protestant men was skilled manual, while that for Catholic men was unskilled manual/unemployed.

Despite this Aunger noted the existence of a sizable Catholic middle-class which he attributed to the high extent of segregation in Northern Irish society, ie the Catholic professional and business class existed to service its own community, for example school teachers and clergy. There exists some related evidence that, at least in the past, Protestants and Catholics tended to patronise shops belonging to members of their own community (see for example, Harris, 1972). Further investigation of the non-manual occupations indicated that Catholics were over-represented in the social services and Protestants in finance and industry: this was particularly true of the professional and managerial category. Aunger found a similar pattern in lower grade non-manual occupations where Catholics were concentrated in routine services. Whereas Catholics tended to operate smaller businesses and shops, Protestants dominated the larger and more substantial business concerns. A third point highlighted for non-manual occupations was that those with the highest proportions of Catholics tended to be low-status, while those dominated by Protestants tended to be high status occupations. Thus, Catholic represented 43% of nurses, but only 21% of doctors; in education Catholics comprised 39% of teachers but only 15% of administrators. Aunger illustrated this relationship between religion and occupational status in the following way: "while a Catholic may be a clerk, it (is) more likely that the office manager will be a Protestant; while a skilled craftsman may be a Catholic, it is more likely that the supervisor will be a Protestant; and while a nurse may be a Catholic, it is more likely that the doctor will be a Protestant". Indirectly related to this was Aunger's finding that non-manual occupations dominated by Catholics tended also to be dominated by women. By contrast the non-manual occupations dominated by Protestants tended to have a minimal female involvement.
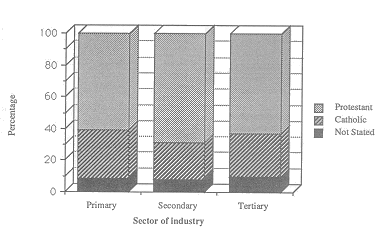
The link between status and religion within occupational categories was also found for manual occupations. Aunger illustrated this by examining the category of labourers. Within industrial groups Catholics were over-represented among labourers. However, comparison between industrial groups indicated a concentration of Protestant labourers in high status industries, such as engineering and textiles, and a concentration of Catholic labourers in low status industries, for example docks and building-contracting. Higher status industries are those with better conditions of employment and/or greater security of tenure.
Aunger concluded that overall there was a link between religion and occupational structure, or in other words, in occupational terms the two communities were not mirror-images of one another. Aunger suggested there were three principal forms of stratification. Firstly, Protestants tended to dominate the upper occupational classes while Catholics were predominantly found in the lower classes. Secondly, Aunger identified a form of vertical stratification such that the religious groups were partially segregated by industry: Protestants were concentrated in high status industries while Catholics were concentrated in low status industries. Aunger described the third as a "more complex form of horizontal stratification" (Aunger, 1983: p40). Although Protestants and Catholics existed in substantial proportions in each occupational category, there appeared to be a within category differentiation such that Protestants were more likely to occupy the high status positions. In consequence, where Protestants and Catholics existed in the same occupational category and in the same working context, Protestants were more likely to occupy positions of authority.
Aunger had noted a tendency for Catholics to be concentrated in
low status industries. This was further explored by a Fair Employment
Agency report (FEA, 1978) which examined the relationship between
religion and industry using data from the 1971 Census. The report
noted that Catholics were two and a half times as likely as Protestants
to be unemployed (see table 3.1) and sought to examine whether
this unemployment differential could be explained, at least in
part, by any difference in the occupational or industrial profile
of the two communities.
 Closer examination of particular industries confirmed and added to the pattern described by Aunger. Thus, a low proportion of Catholic men were employed in engineering, while a high proportion were employed in construction, traditionally more susceptible to unemployment (see section 8). There was low employment of Catholic men in insurance, banking, and finance and business services, while both Catholic men and women were poorly represented in public utilities. There was only a low correlation between wage levels and Catholic involvement, although those industries with the highest wage levels had the lowest Catholic involvement. It was possible to match occupations to industry only for construction and engineering. This revealed that for the construction industry Catholics tended to be employed in lower status occupations. In engineering, a high status industry, there was a general under-representation of Catholics in most occupations and this was most marked for managerial occupations. The conclusion of the FEA report was that the occupational and industrial profiles of the two communities did appear to contribute to the unemployment differential between them. Having said this, the report noted that a geographical factor might have played a role although it was not, at that stage, possible to quantify this factor.
Data for figure 3.1:1971 census: socio-economic distribution by
religious affiliation (percentages)
| ||||||||||||||||||||||||||||||||||||||||||||||||||||||||||||||||||||||||||||||||||