Section Four
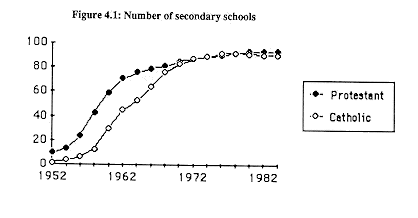
Secondary Intermediate schools Secondary intermediate schools were established after the 1947 Act to provide free post-primary education for the majority of pupils in Northern Ireland. As has been already described, many pupils remained in unreorganised primary schools after this time and figure 4.1 helps to explain why this occurred. In the immediate post-war period it took some time to build the new secondary intermediate schools, with the main period of growth being in the late 1950s and early 1960s. Figure 4.1 charts the growth in these schools in the controlled (Protestant) and maintained (Catholic) sectors. There are a number of interesting patterns revealed in this graph. Firstly, the main period of rapid growth in Protestant secondary schools began in 1954 and continued until 1962. By contrast, among Catholic secondary schools the main period of rapid growth did not begin until 1958. In other words, there was a four-year time lag in the provision of secondary intermediate schooling in favour of pupils attending Protestant schools. In the longer term this may have had some impact on the employment prospects of Protestant and Catholic pupils, although it should be noted that as late as 1971 over 80% of the pupils attending secondary schools left school with no O Level or CSE qualifications.
This differential rate of growth in the secondary sector continued
until 1962, at which time the rate among Protestant schools began
to slow down. By contrast, among Catholic schools the rate of
growth remained high so that by 1972 the number of Protestant
and Catholic secondary schools had equalised. This relative parity
has remained into the 1980s.

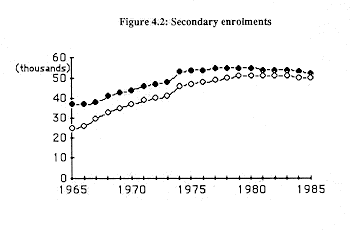
Figure 4.2 presents the number of pupils in Protestant and Catholic
secondary schools from 1965 until 1985. Until the late 1970s
both sectors saw a steady increase in enrolments with that of
Catholic schools slowly closing the gap. It should be noted from
figures 4.1 and 4.2 that while the number of schools had equalised
by 1972, there still remained more pupils in Protestant secondary
schools. By the end of the 1970s the decline which had been observed
in primary enrolments from 1972 onwards had begun to affect the
secondary schools. It should be noted from figure 4.2 that since
the decline in enrolments was greater among the Protestant secondary
schools, the number of pupils in Catholic schools had almost reached
parity by 1985.

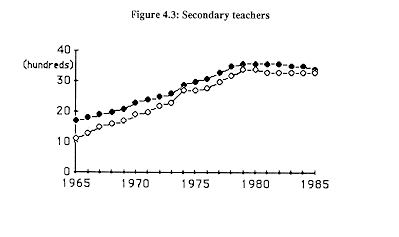
Figure 4.3 presents the number of teachers employed in Protestant
and Catholic secondary schools from 1965 to 1985. As with the
primary teachers, there was a sustained growth in teacher numbers
in both sectors until falling rolls halted growth. However, in
the secondary schools there appears to have been little time lag
between the start of falling rolls and the reduction in teacher
numbers. The figure suggests further that the number of teachers
employed in Catholic secondary schools increased at a slightly
higher rate compared with the Protestant schools until 1979 and,
by 1985. had almost achieved parity.

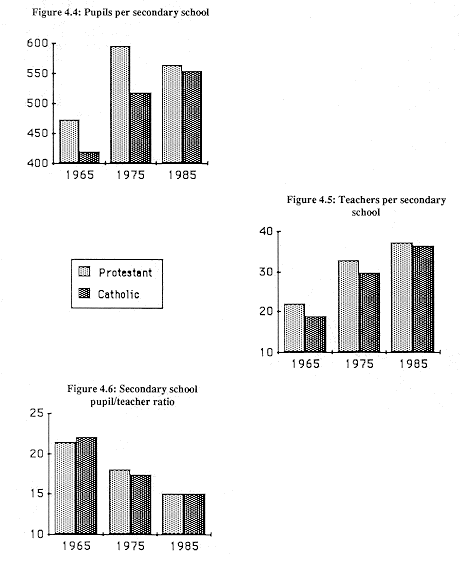
Figures 4.4 to 4.6 present a comparative picture of the 'average'
Protestant and Catholic secondary school. Figure 4.4 reflects
the differential impact of falling rolls in the late 1970s.

Between 1965 and 1975 the average enrolment increased in both sectors, but while the average enrolment of Catholic secondary schools increased slightly between 1975 and 1985, among Protestant secondary schools the average enrolment declined. Figure 4.5 presents the average number of teachers per school for both sectors and while this has increased over the years, the rate of increase has been higher among Catholic secondary schools. Thus in 1985 the average number of teachers employed in Catholic secondary schools was almost equal to that of Protestant secondary schools.
Despite the differential patterns of growth in terms of the average
pupil enrolment and the average number of teachers per school
the pupil/teacher ratio has continued to fall and has remained
about equal in both sectors.
As in the primary schools there is a differential rate of funding
for these schools. While all secondary schools receive 100% funding
for recurrent expenditure, Catholic secondary schools receive
only 85% capital expenditure. To date, however, there appears
to be little direct evidence on the relative impact of these funding
differences on the resources and facilities available in the secondary
schools. In addition, there appears to be little direct evidence
yet on the effect of contraction in both sectors. There are two types of grammar school in Northern Irland: controlled and voluntary. Education and Library Boards have full responsibility for controlled grammar schools, which can be considered to be Protestant schools. Voluntary grammar schools, which comprise the bulk of grammar provision in Northern Ireland, are relatively autonomous of area boards and are run by boards of governors or trustees. Controlled grammar schools receive 100% funding from the Education and Library Boards for recurrent and capital expenditure while voluntary grammar schools receive 100% for recurrent expenditure and up to 85% funding for agreed capital expenditure. Even though voluntary grammar schools are likely to have the greatest extent of religious heterogeneity in their pupil populations, compared with primary and secondary intermediate schools, there are no planned integrated voluntary grammar schools and they can be classified as Protestant or Catholic.
Unfortunately, much of the published research on grammar schools
does not distinguish between Protestant and Catholic voluntary
grammar schools. Research evidence which does make this distinction
is largely covered in other sections of this review. Thus the
concentration of preparatory departments in Protestant grammar
schools has been mentioned in section 2 and the greater extent
of the Protestant grammar sector and reasons for this disparity
have been discussed in section 3. Section 5 will examine some
evidence on curriculum differences in Protestant and Catholic
grammar schools while section 6 will examine differences in pupil
attainment.
This section raises two main issues for future research. The
first concerns the impact of different funding arrangements for
Protestant and Catholic secondary and grammar schools. As yet
there is little evidence on this issue. At a more fundamental
level, it is not possible to distinguish Protestant and Catholic
grammar schools on the basis of published DENI statistics: given
that grammar schools provide the most direct route to higher education
and the occupational advantages accruing from this, it is important
to have basic statistical information on the availability and
operation of grammar schools for both communities in Northern
Ireland. In other words, DENI publications should officially
recognise the existence of two religious school systems in Northern
Ireland and provide a basis for comparing them.
| ||||||