
|
|
|
|
|
|
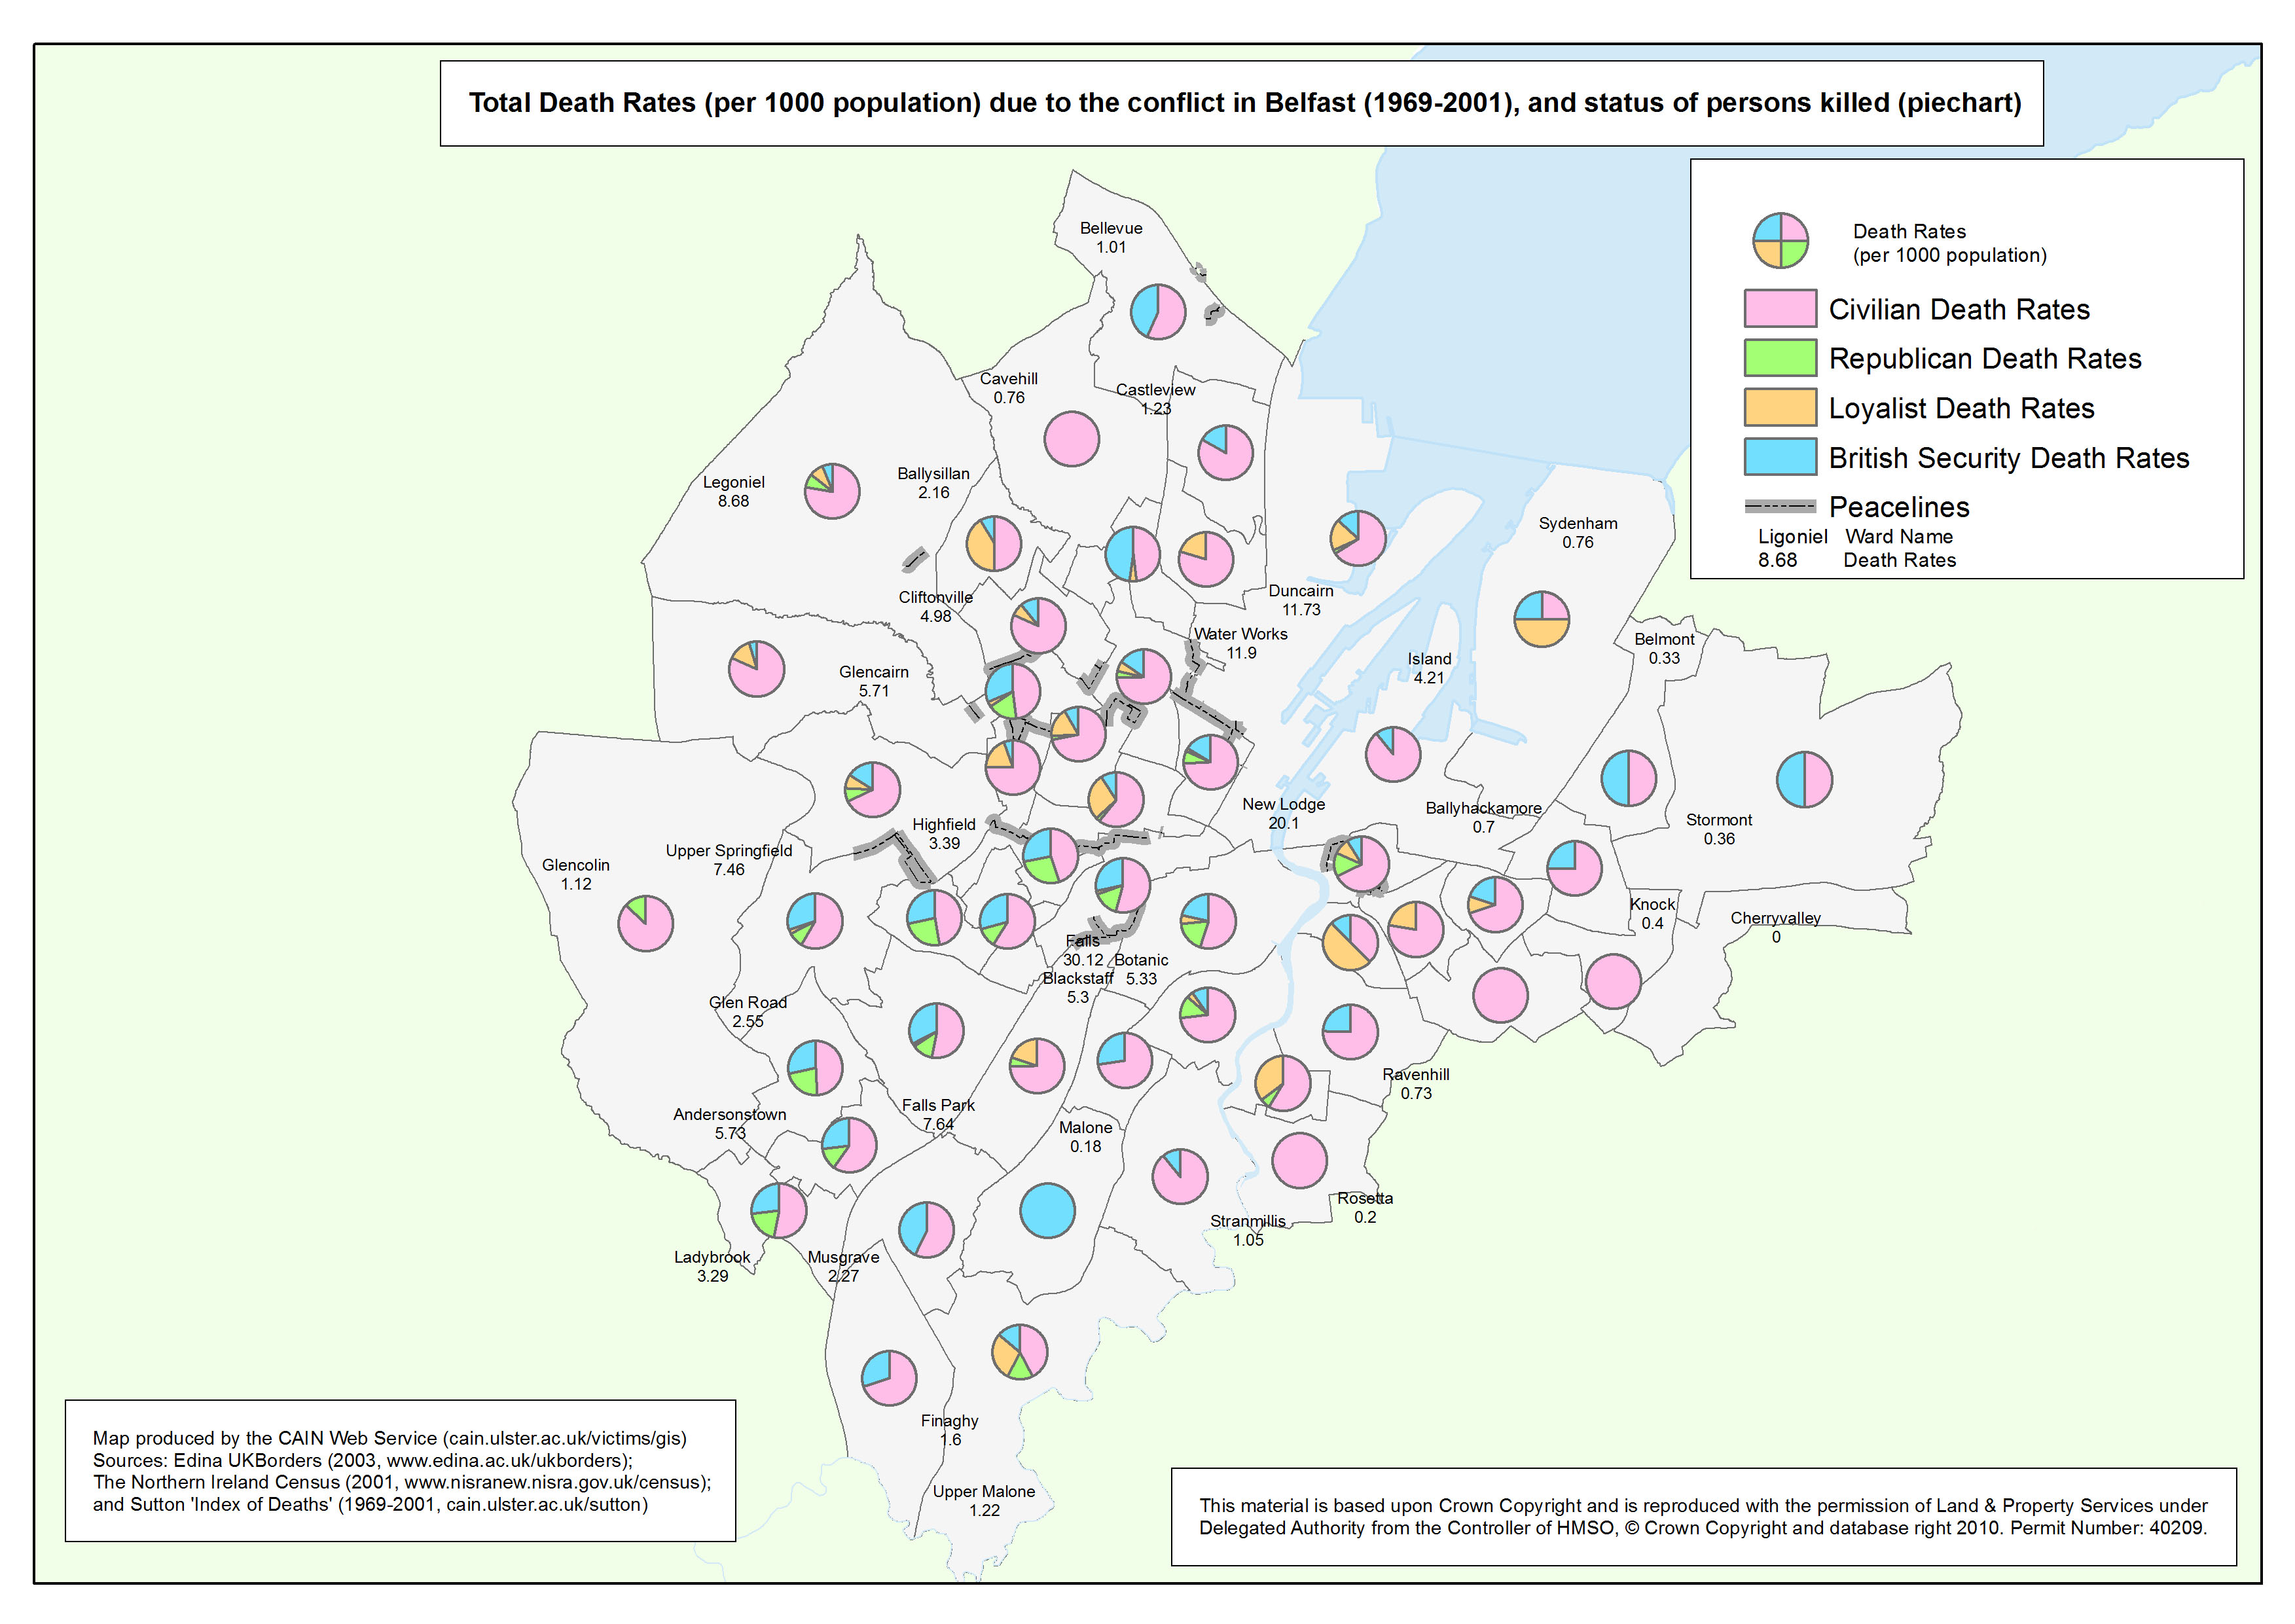
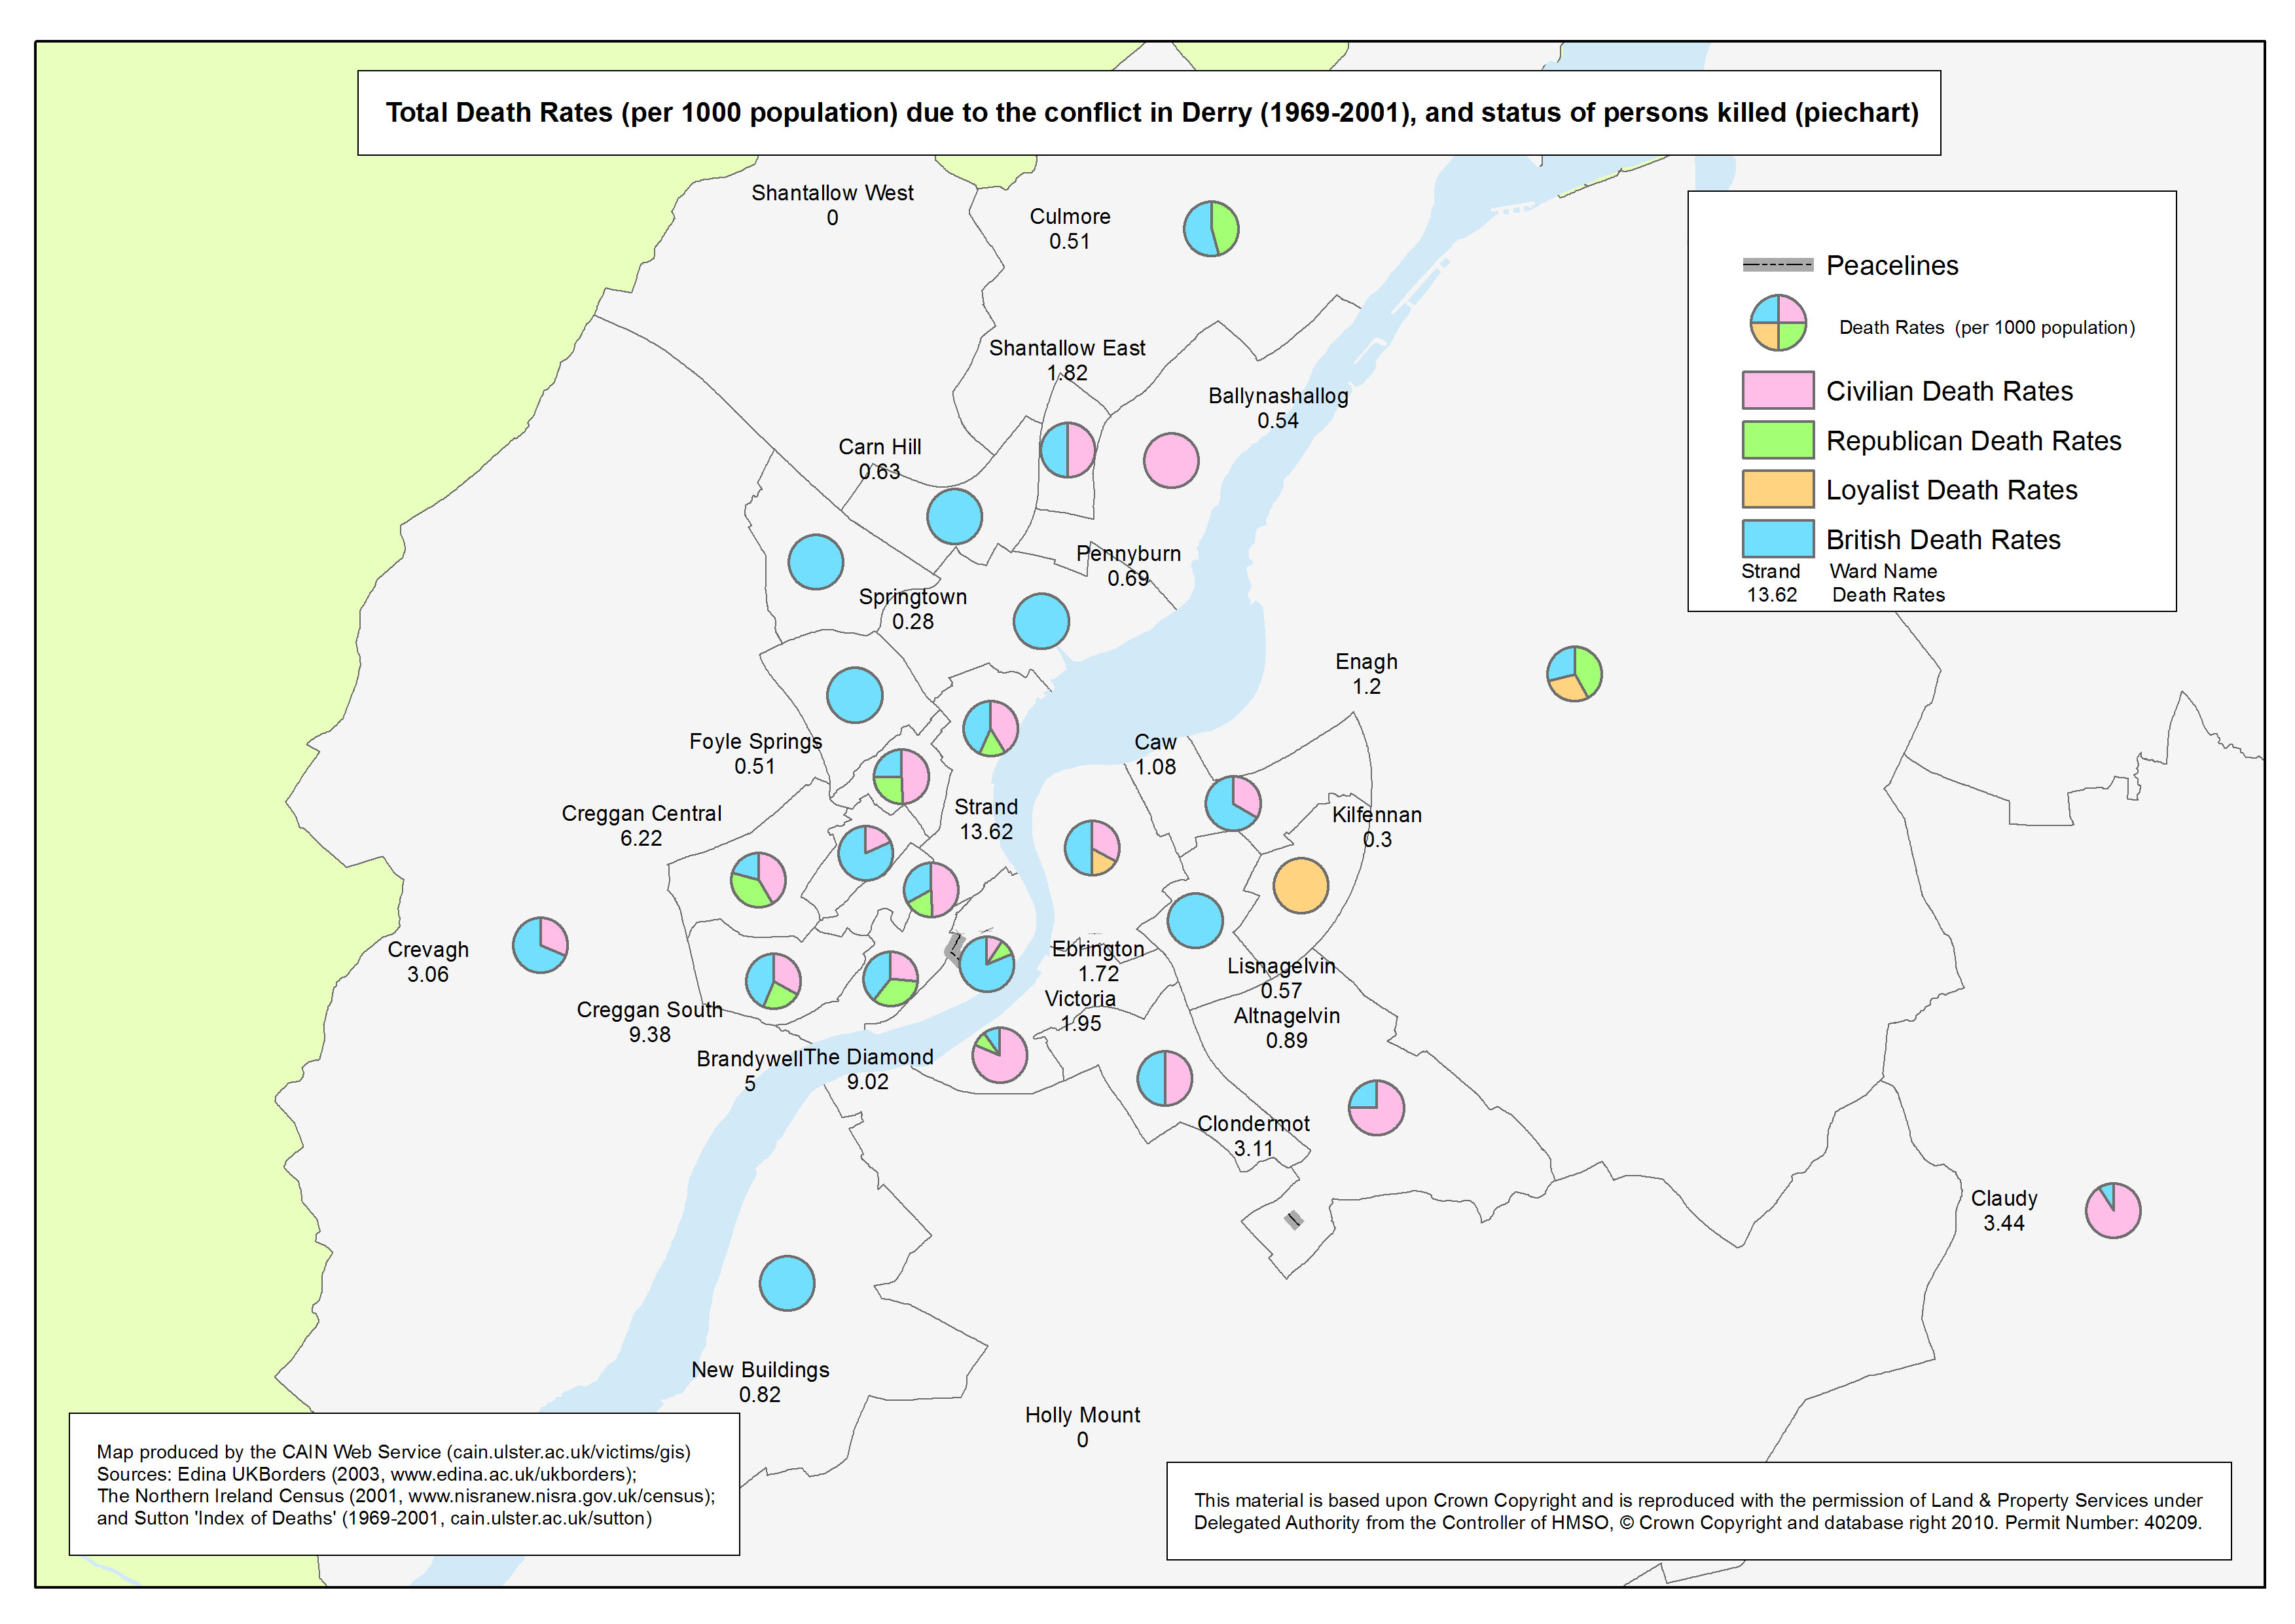
Pie Chart Maps - Total death ratess (1969-2001), by area (Belfast, Derry), by status, at ward level (2 maps)
There are 582 electoral wards in Northern Ireland as defined by the Boundary Commission for Northern Ireland in 1995. The electoral ward shapefile was downloaded from EDINA borders website. The ‘peacelines’ erected during the troubles with the intention of minimising conflict at interface areas are identified and located. The peacelines shapefile was downloaded from the Northern Ireland Statistics and Research Agency (NISRA).
The number of deaths is based on the Malcolm Sutton Index of Deaths (1969-2001): The electoral ward shapefile was downloaded from EDINA borders website: The peacelines shapefile was downloaded from the Northern Ireland Statistics and Research Agency:
The GIS maps listed above have been produced as part of the AHRC 'Visualising the Conflict' Project. The maps have been reproduced and made available with the permission of Land & Property Services under Delegated Authority from the Controller of HMSO, © Crown Copyright and database right 2010; Permit Number: 40209. All maps were prepared by Luke Kelleher, then a Research Associate (GIS) working with CAIN. All maps were sized A4 (approximately). GIS software was used to produce TIFF versions (A4 approx; 300dpi) which are available on request. Three versions of each map have been made available above:
Return to List of Map Sets
|
||||||||||||||||||||
|
Last modified:
January 20, 2012 9:33
|
||
|
|
||
 This set of maps focuses on the urban areas of Belfast and Derry. The maps show the total death rates per 1000 population at ward level, due to the conflict, and employ a pie chart to identify the status of the victims within each ward. The information used to locate and plot each death is provided by Malcolm Sutton’s Index of Deaths 1969-2001 .
 Pie Chart Map - Derry
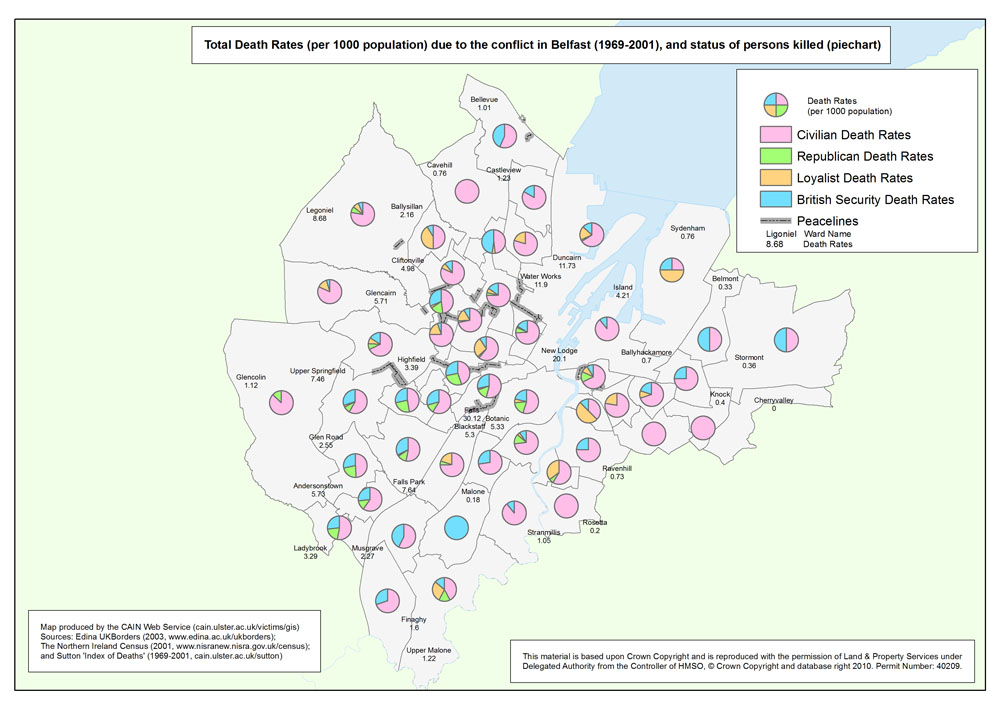