
|
|
|
|
|
|
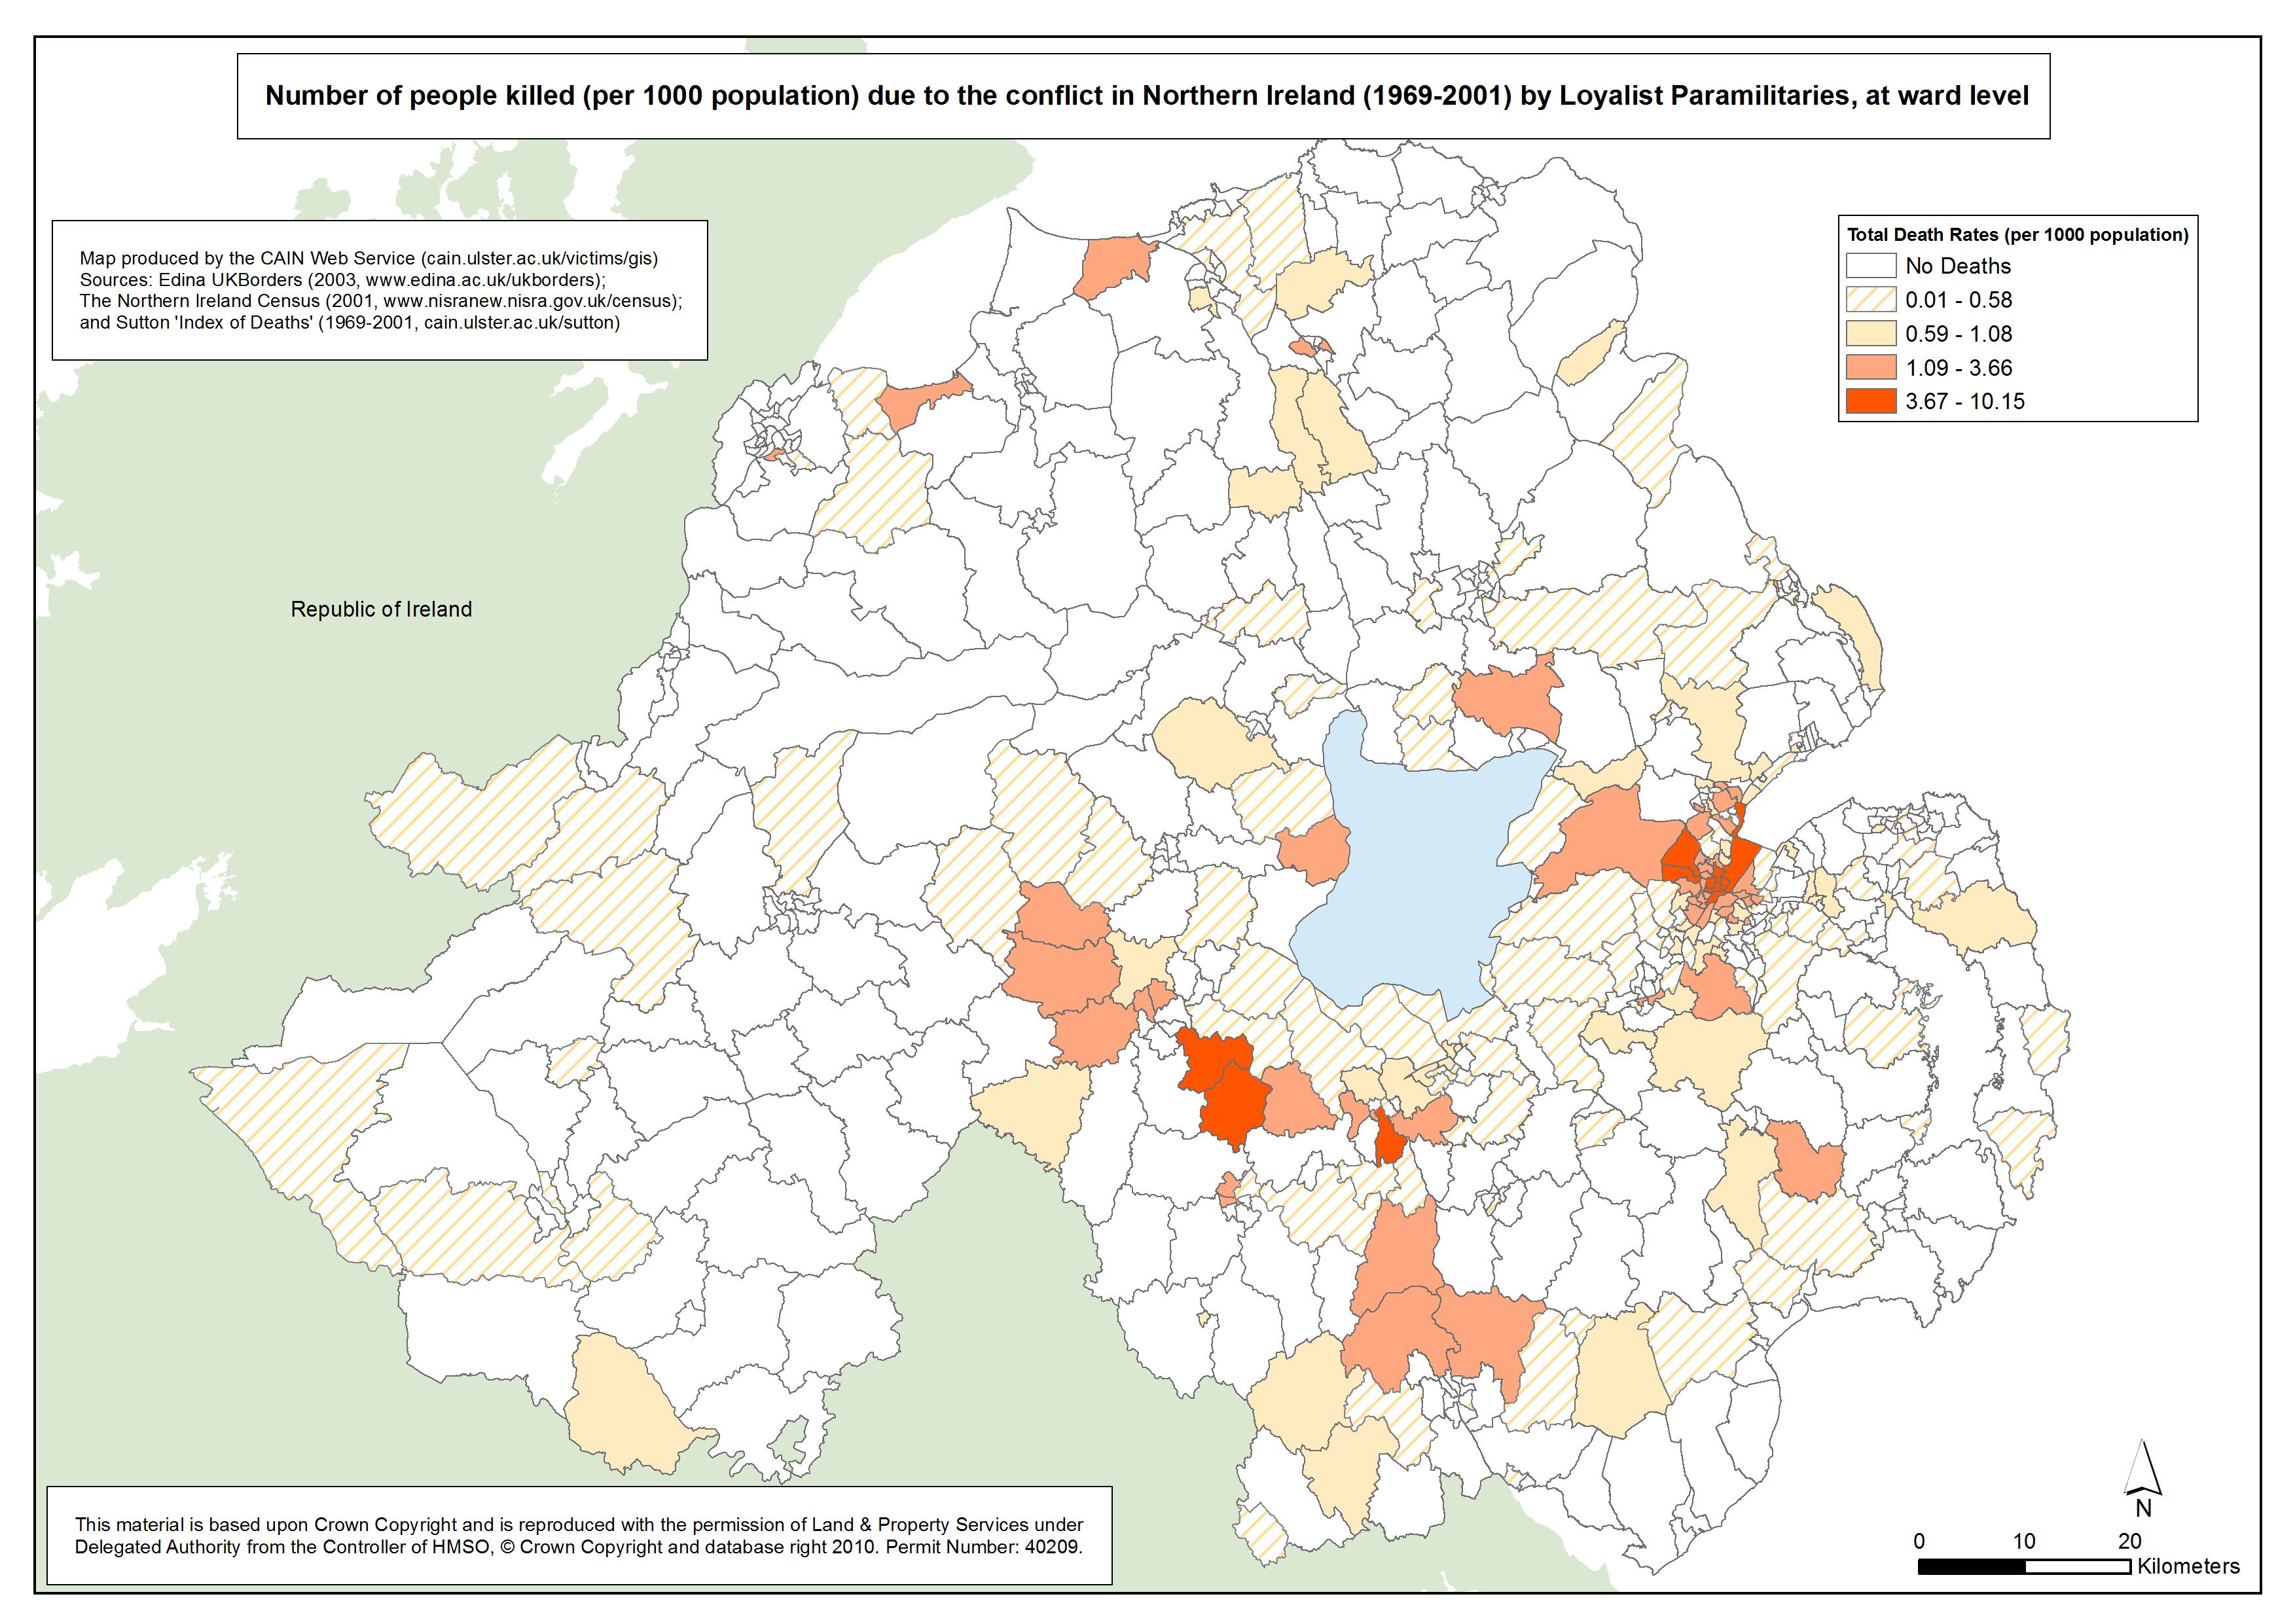
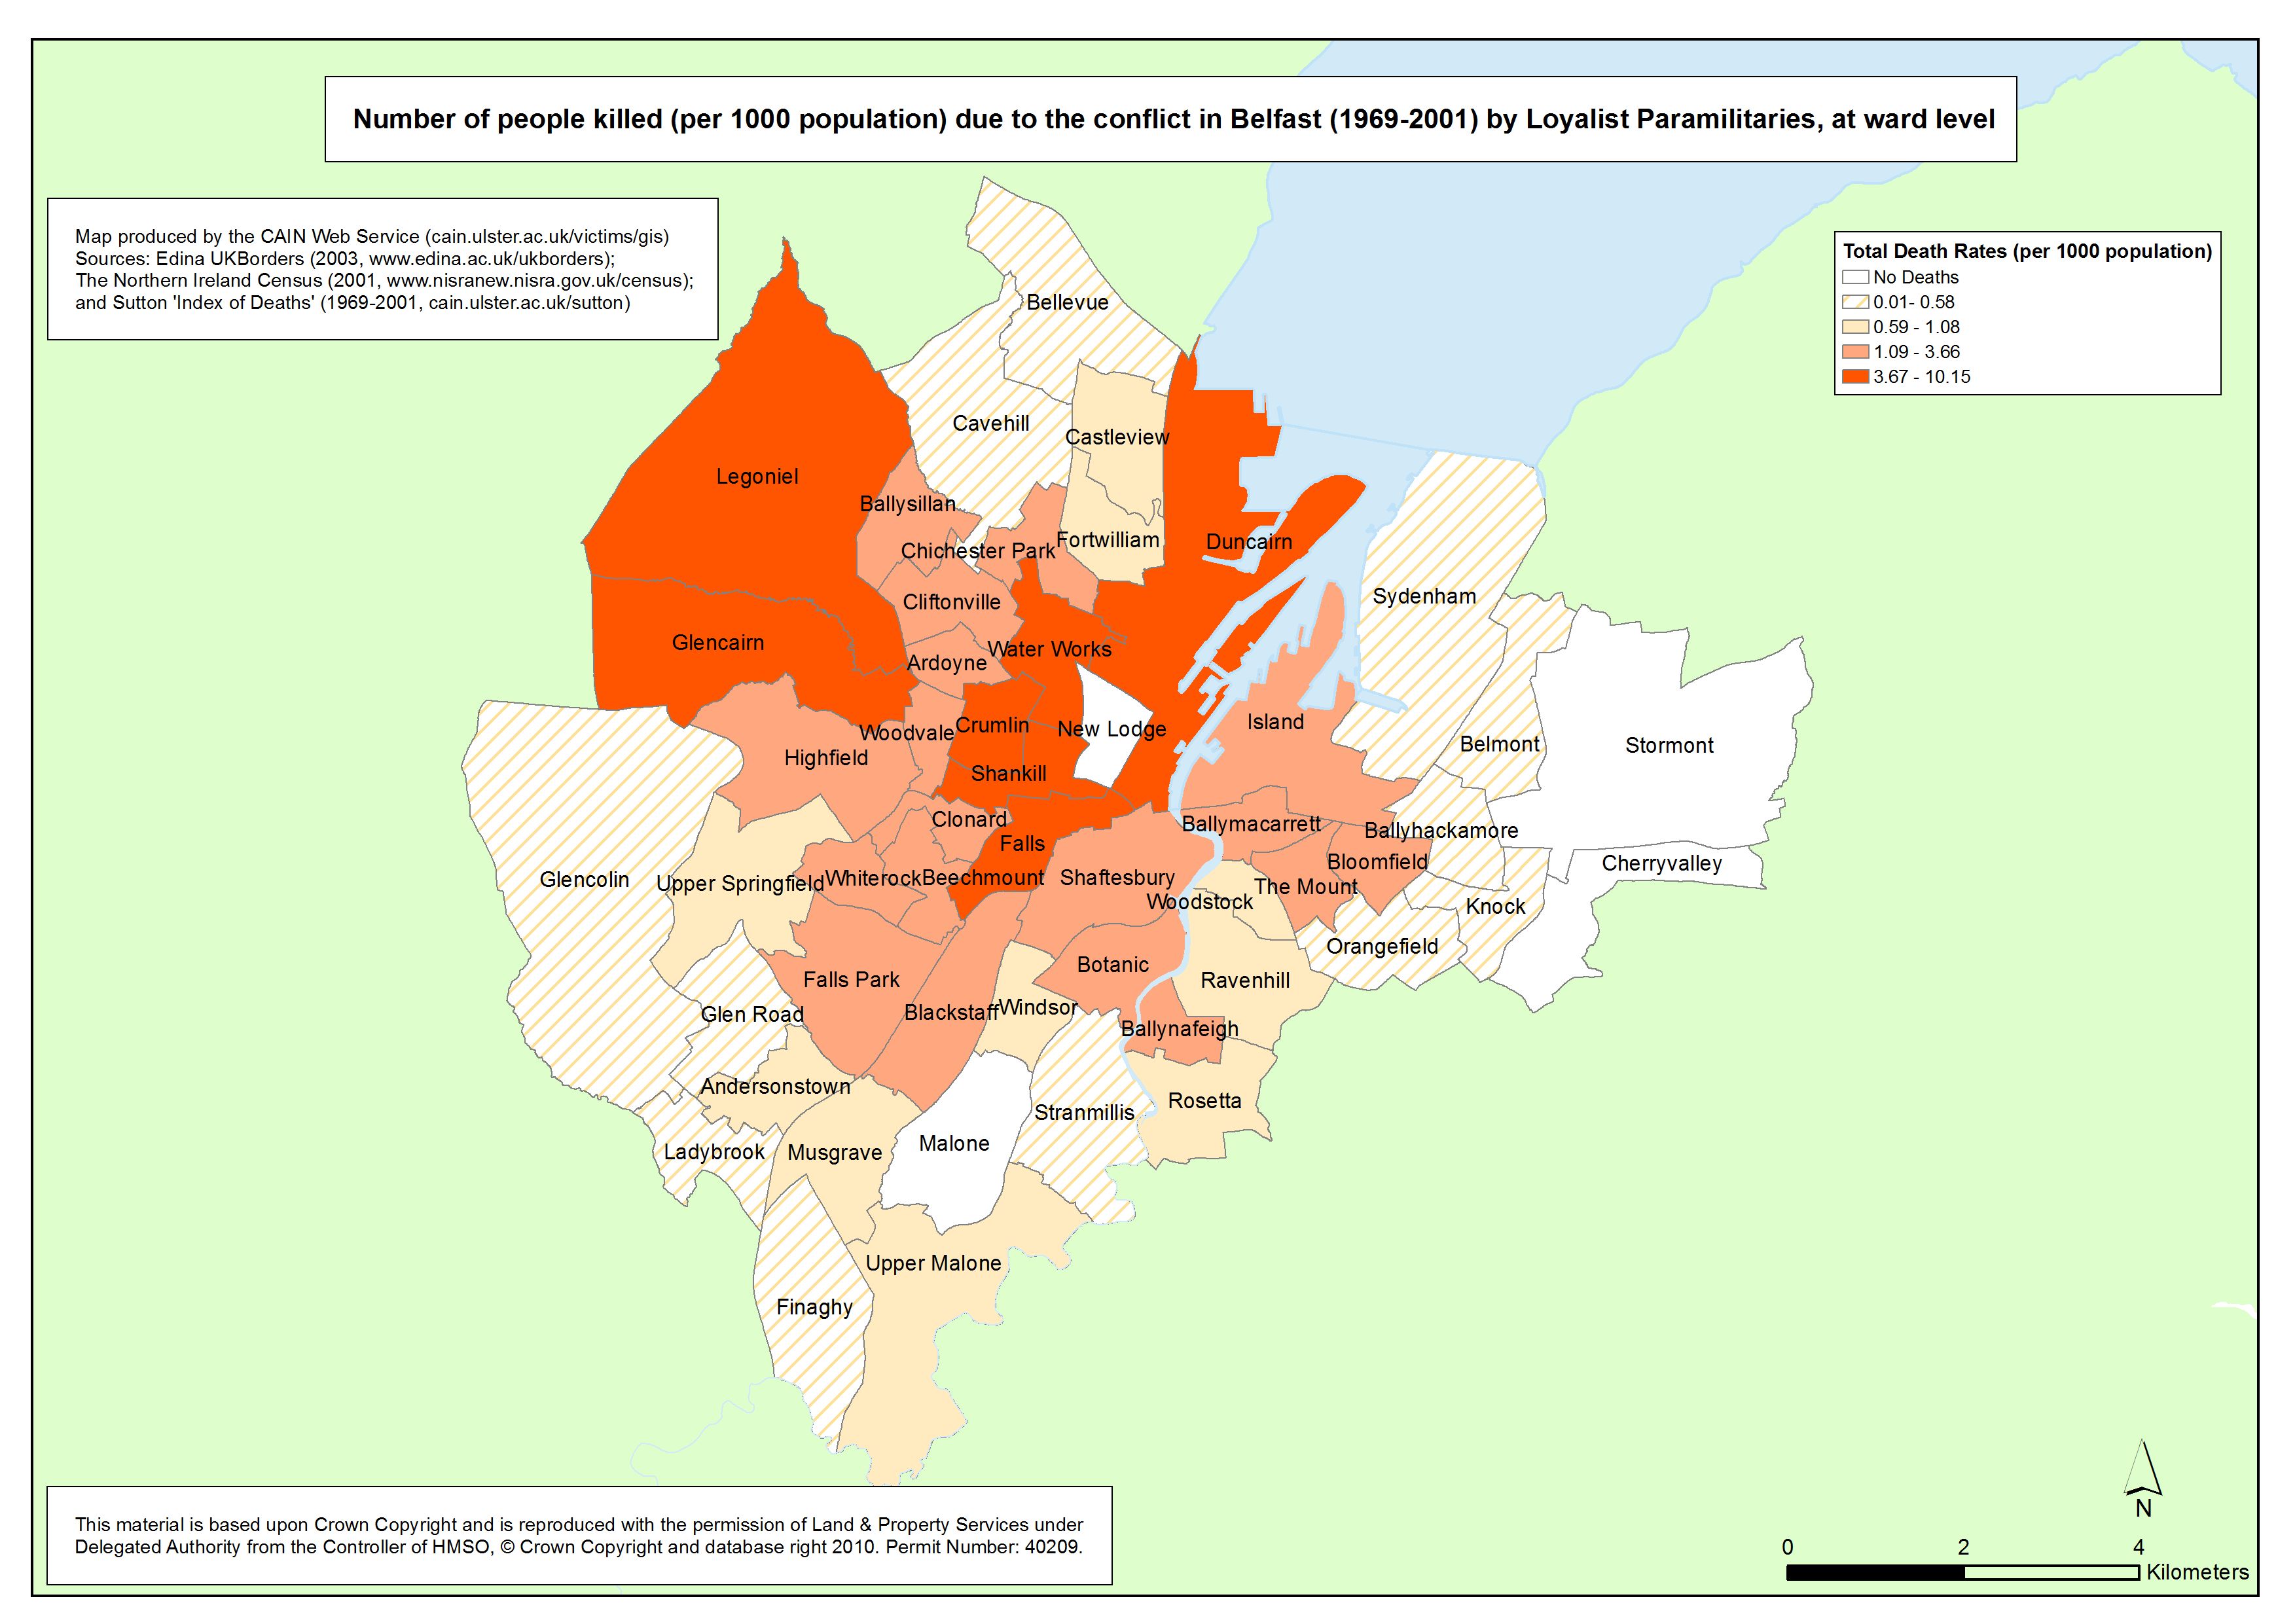
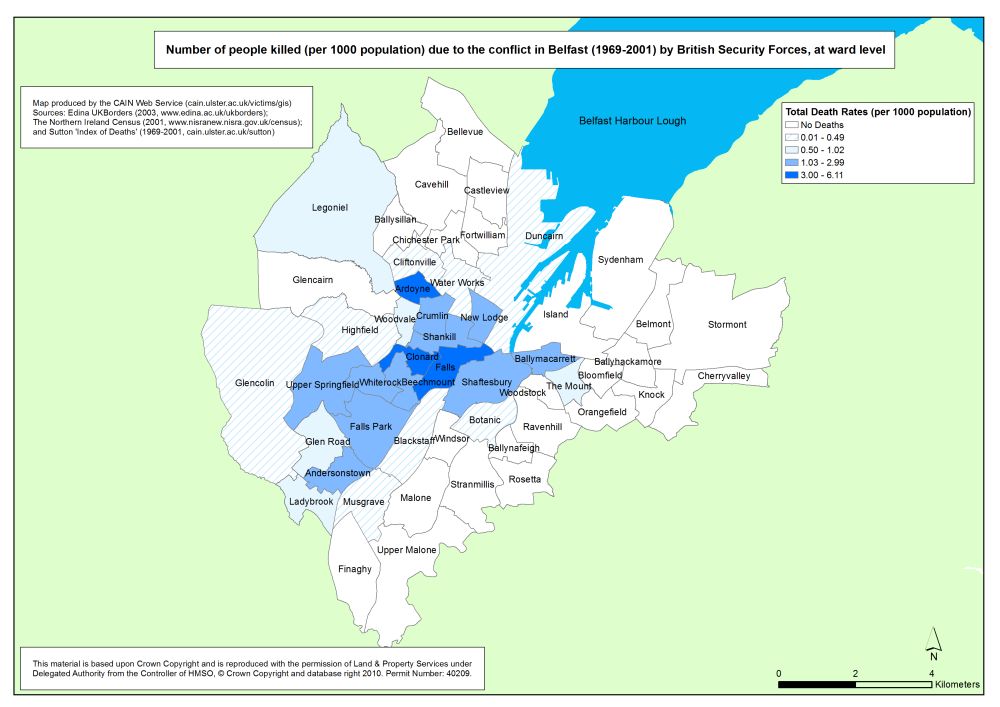
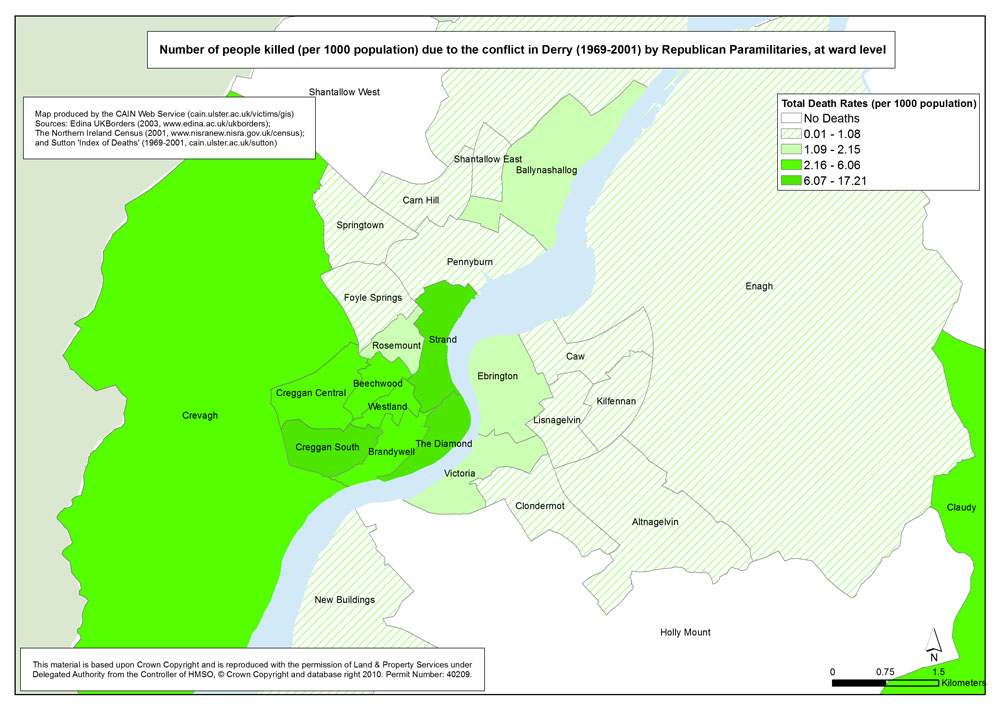
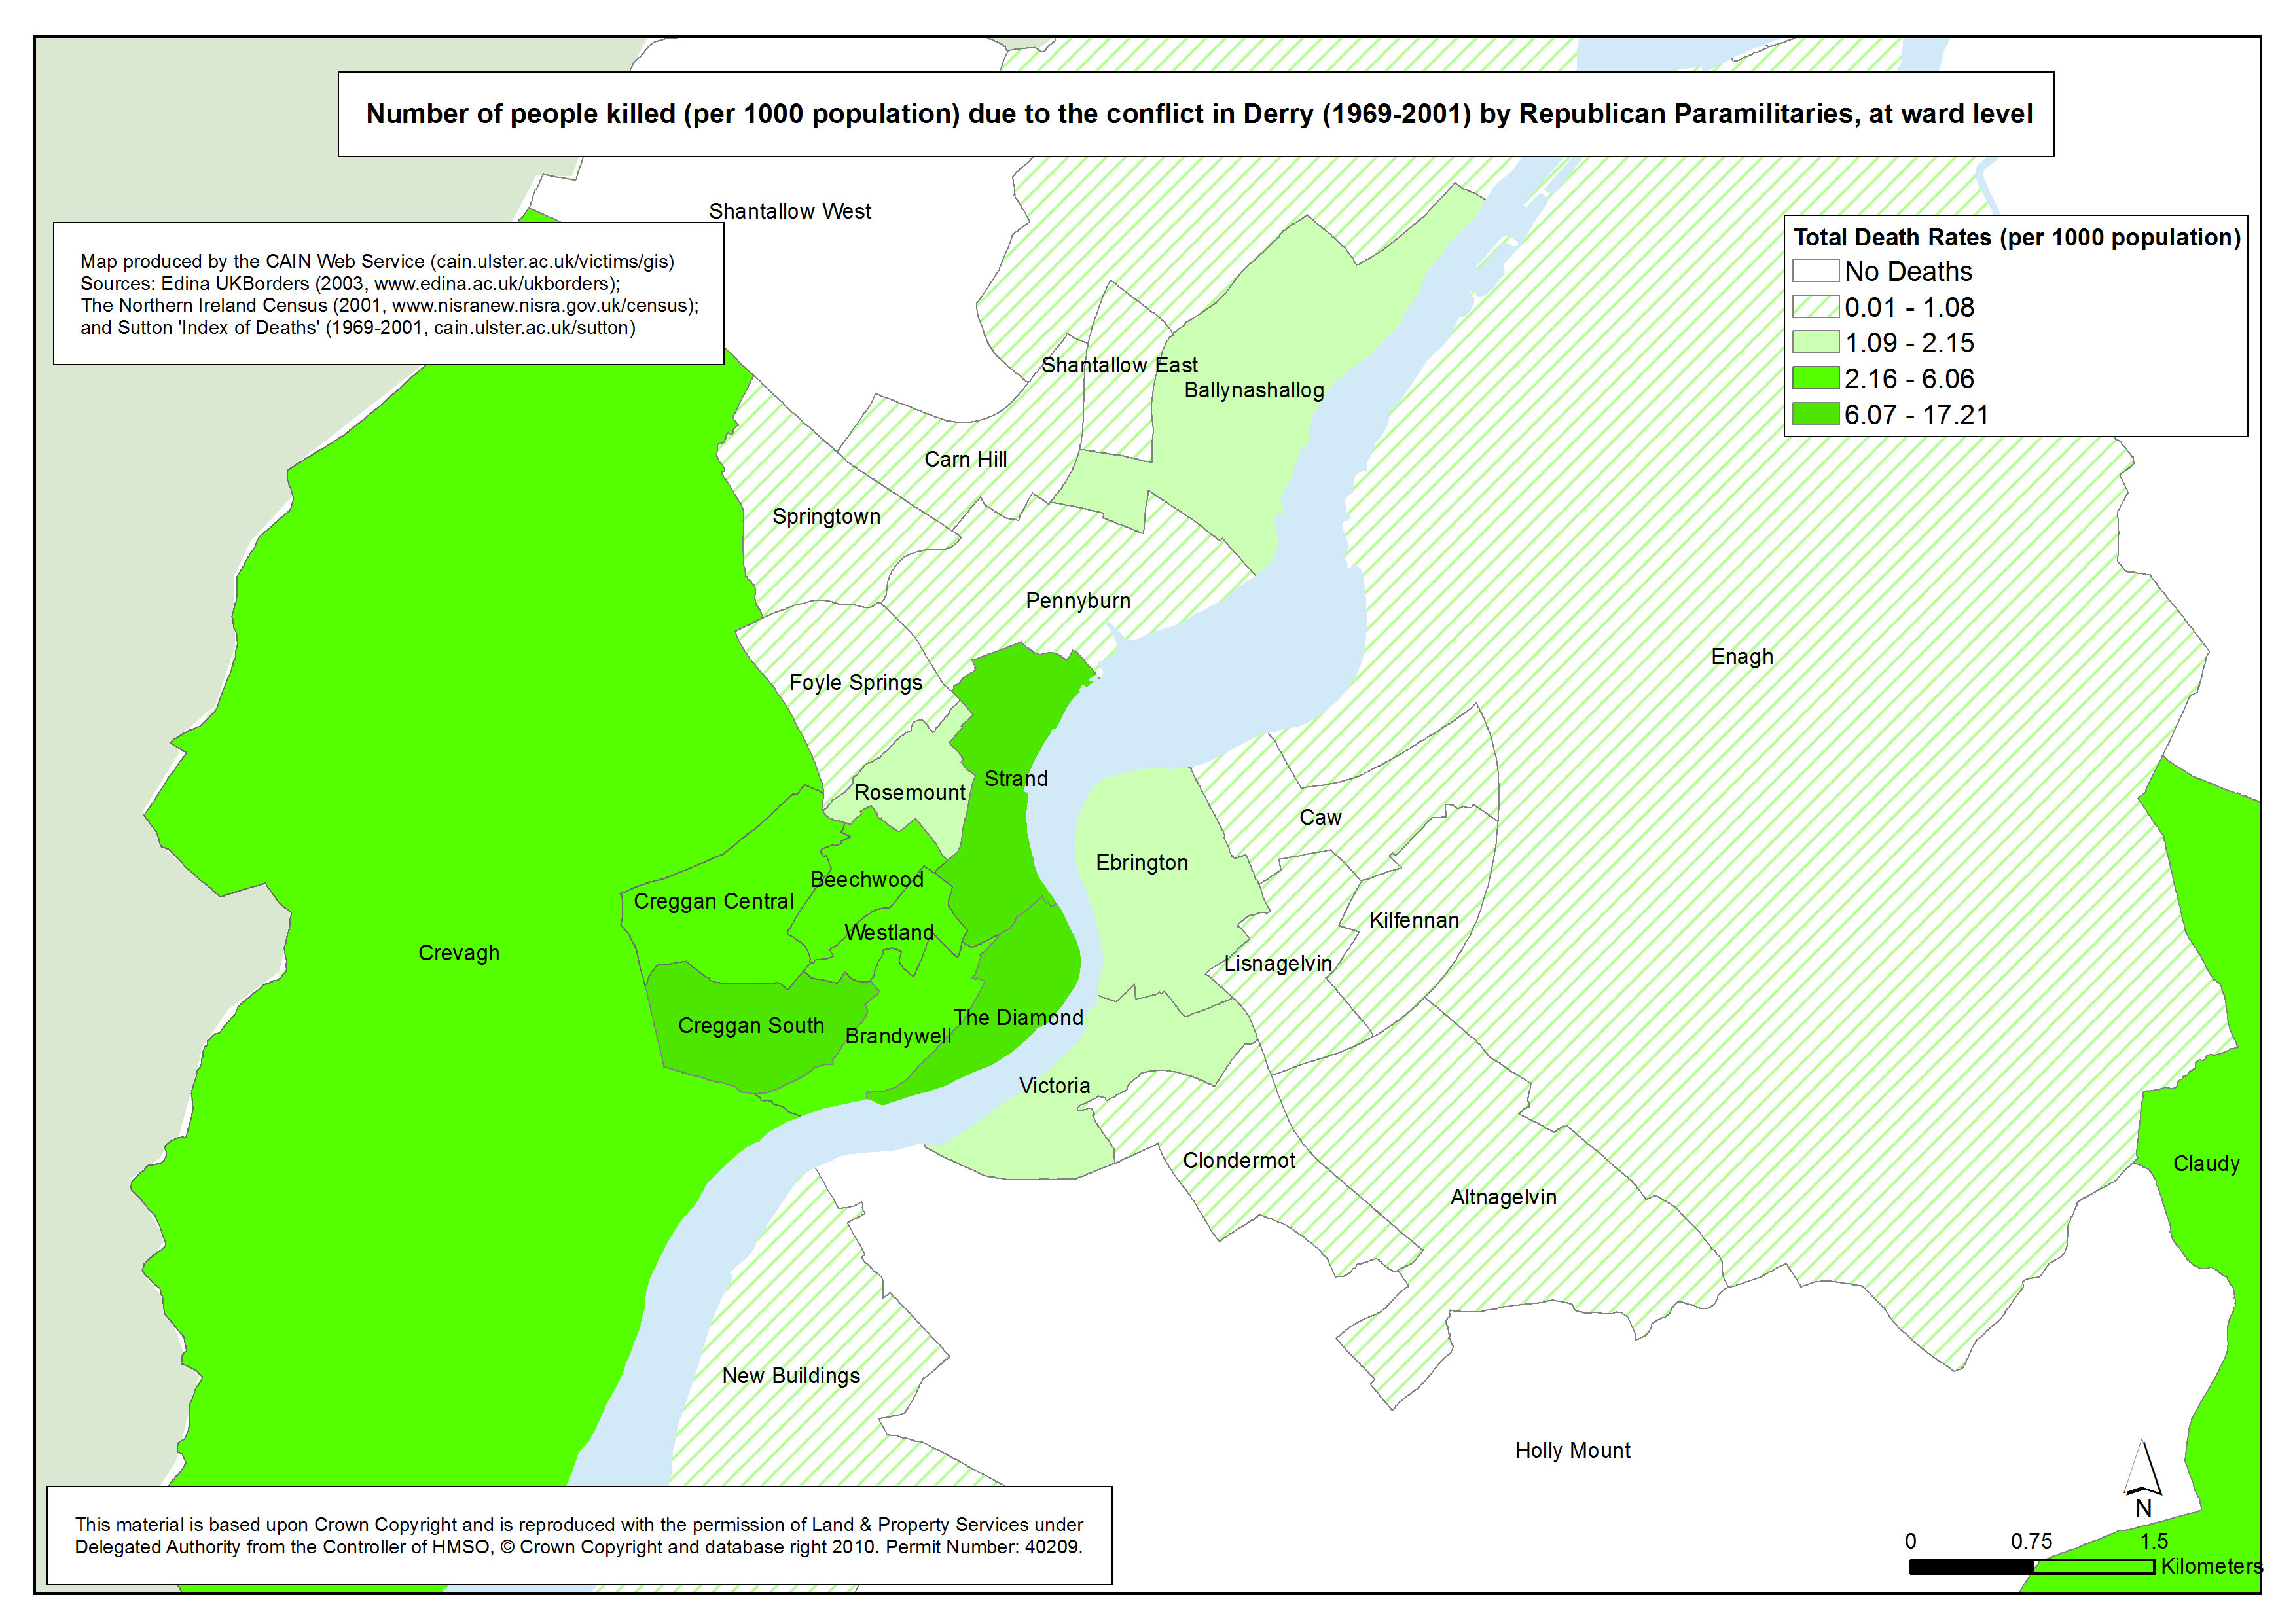
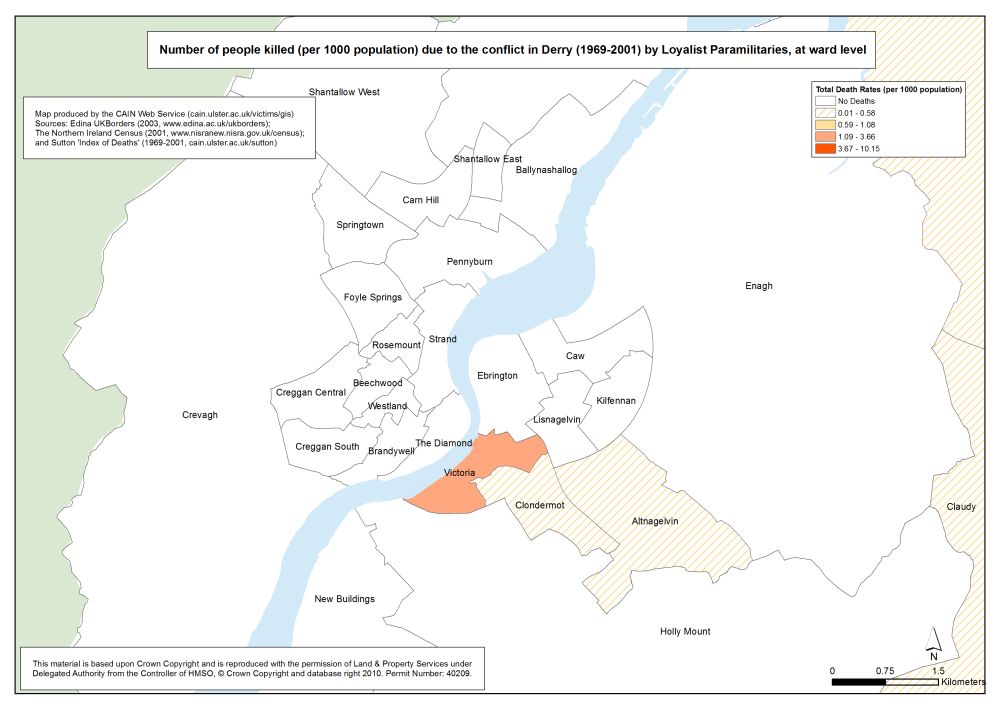
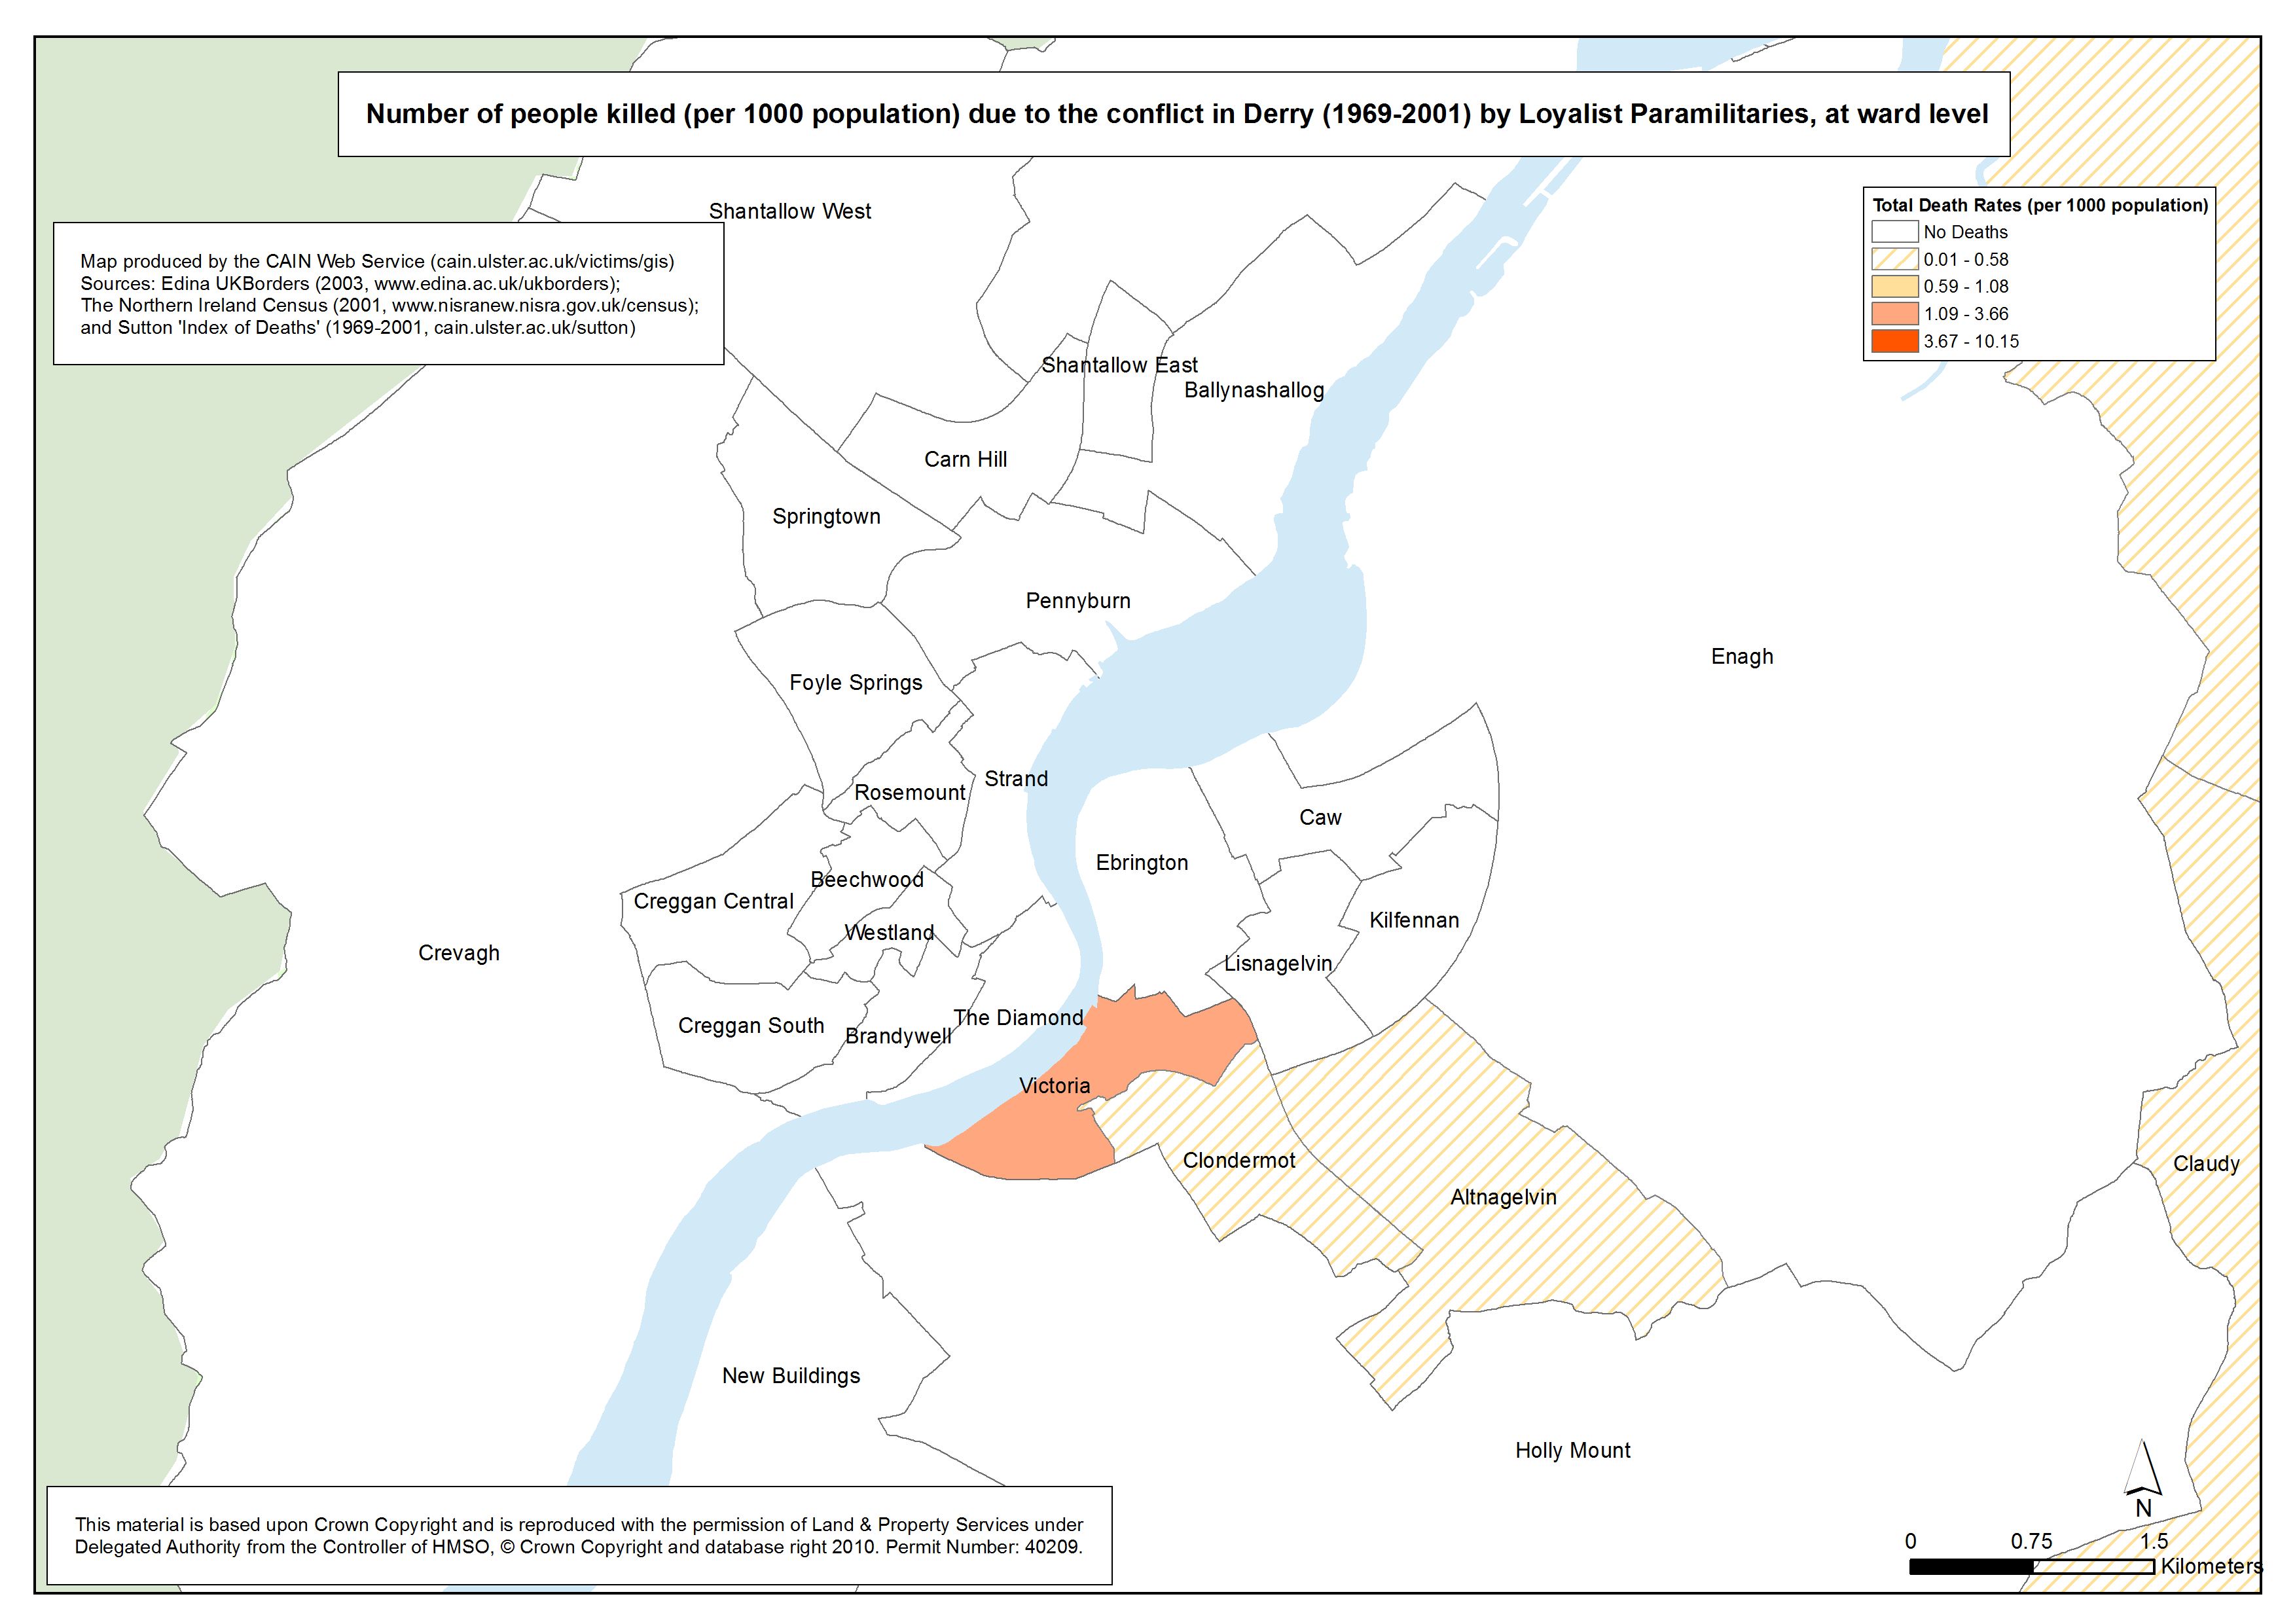
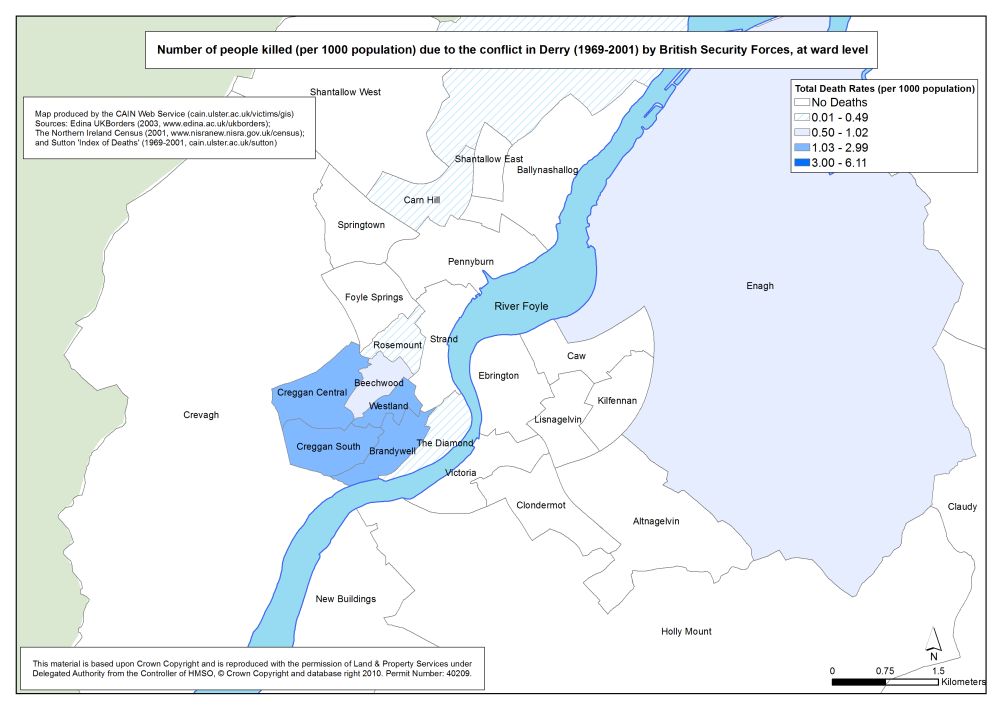
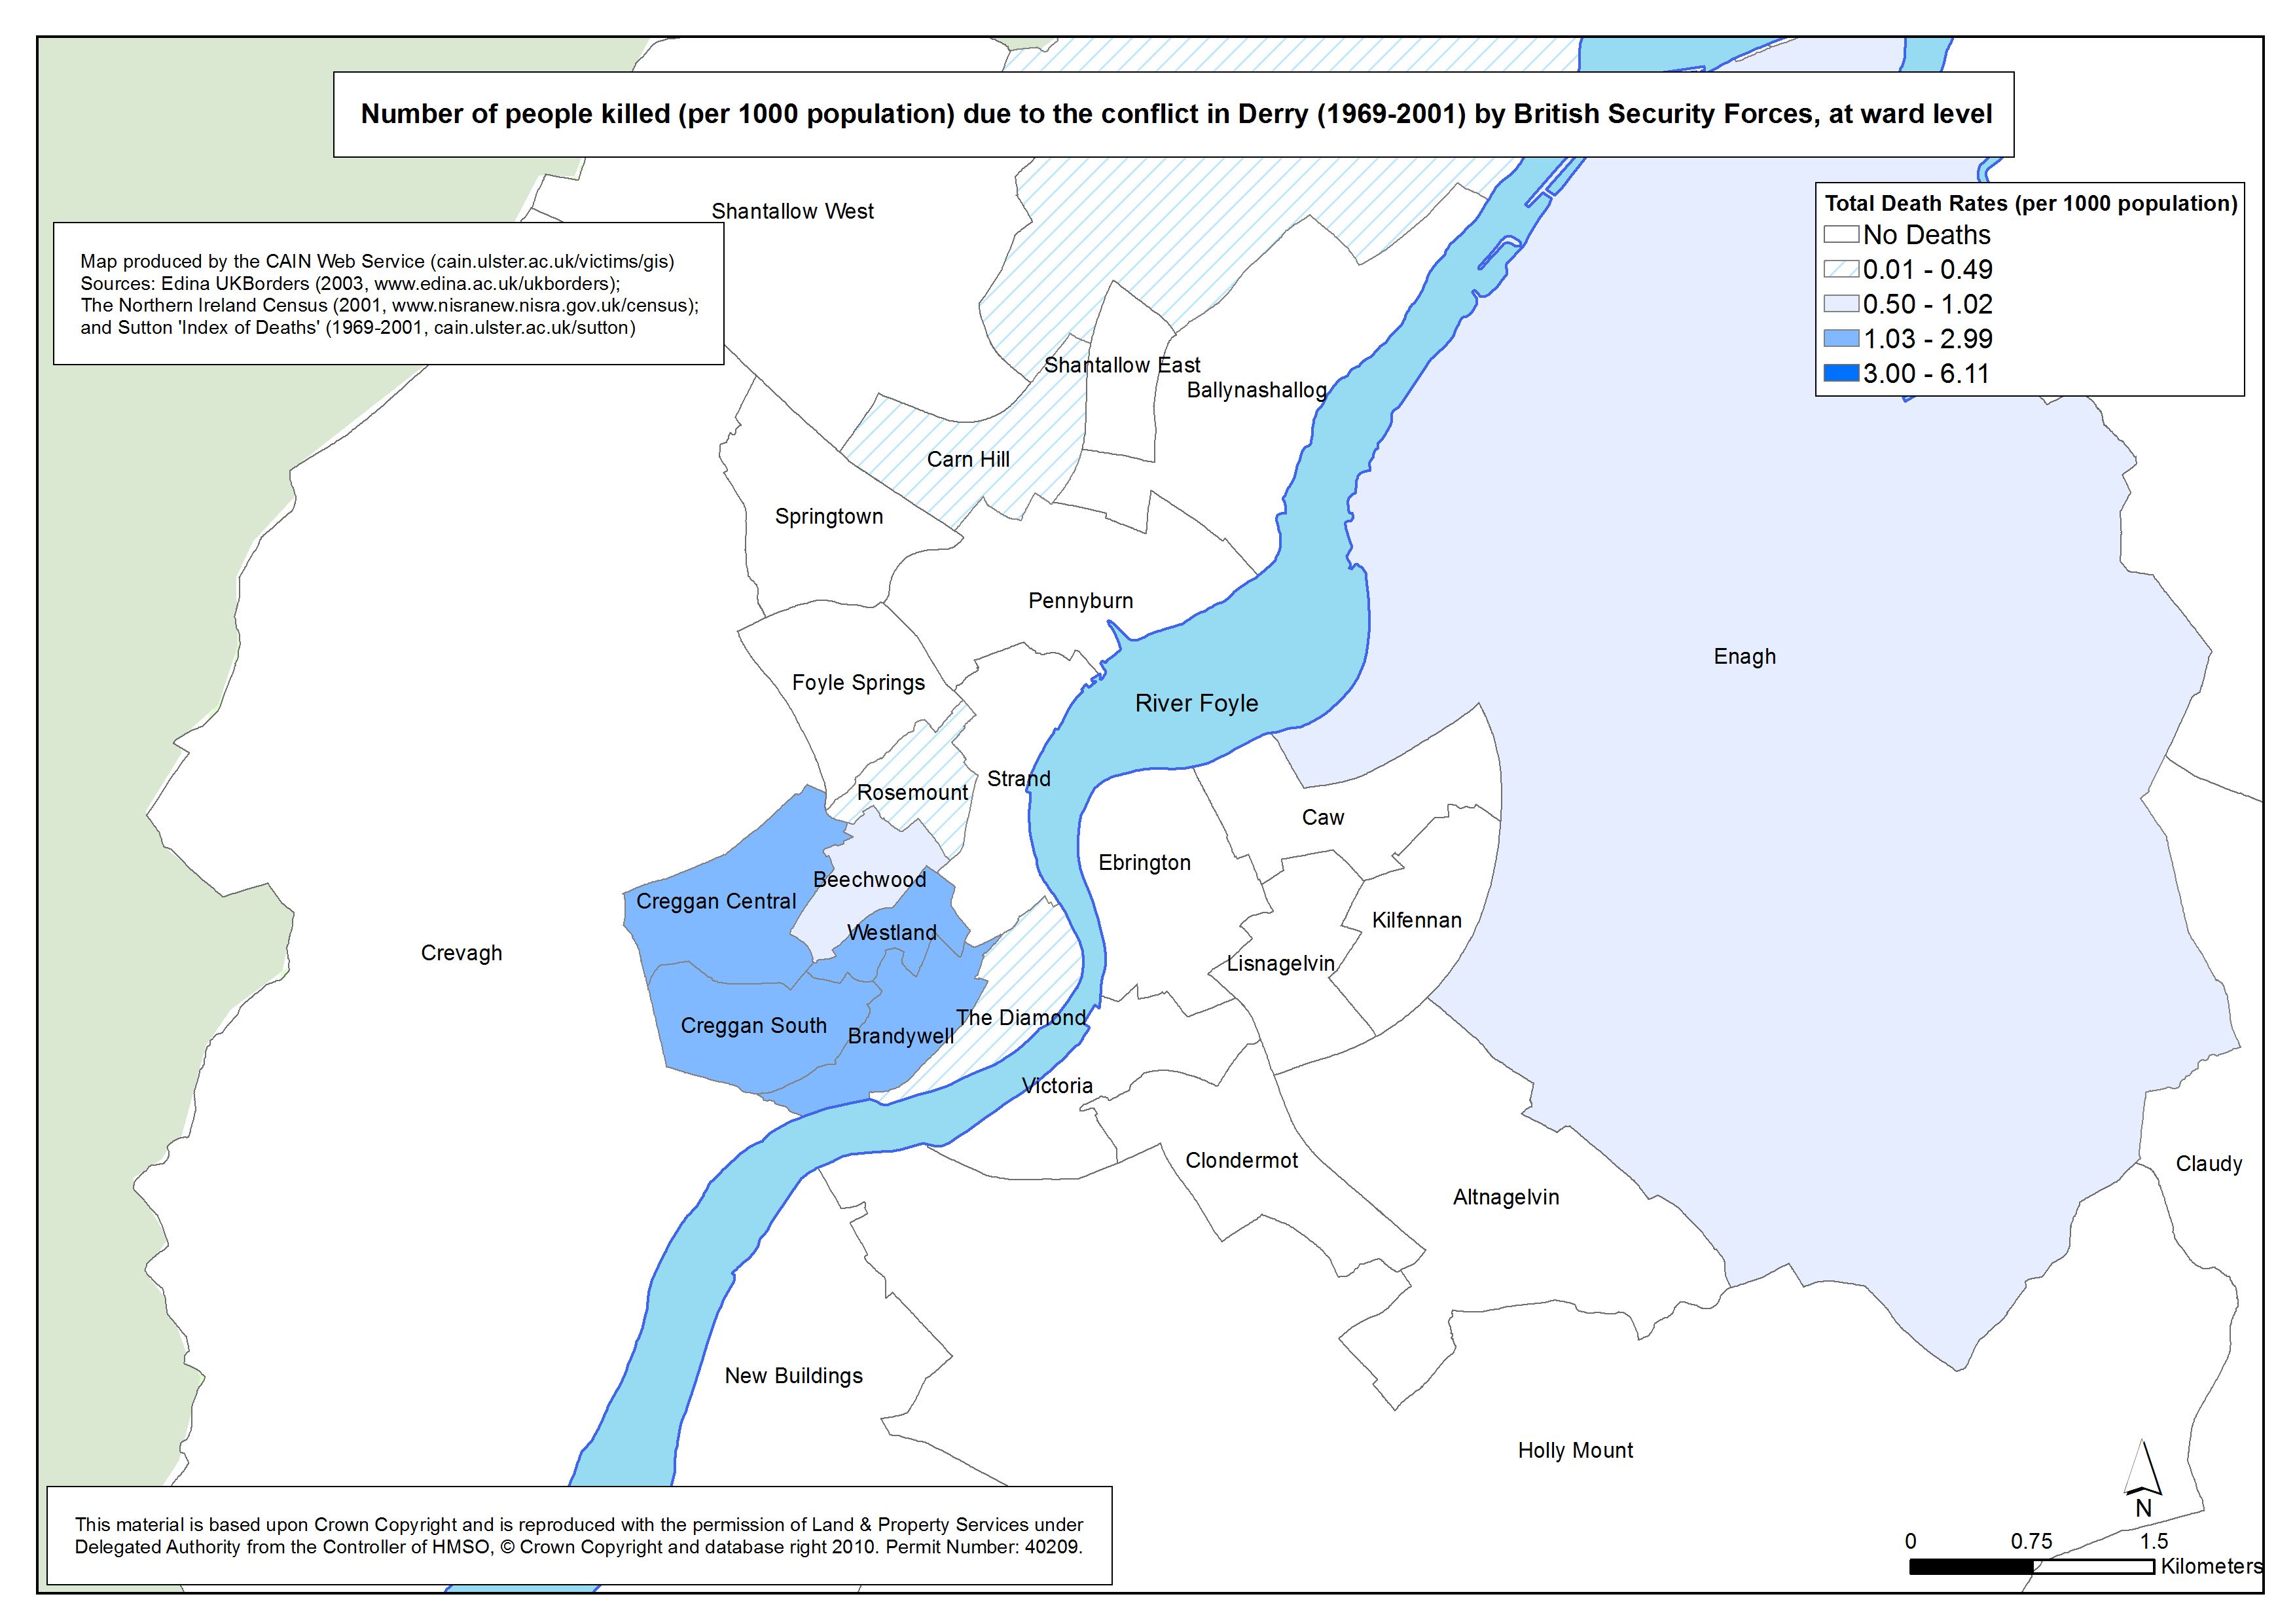
The death rate was calculated by dividing the total number of deaths during the conflict (as recorded in the Sutton Index of Deaths) by the population within the wards which the deaths occurred. The 2001 census population counts for each ward were used. Three categories of deaths have been mapped: all those killed by Republican paramilitaries; all those killed by Loyalist paramiliaries; and all those killed by British Security Personnel. Three geographical areas have been mapped for each of these categories: Northern Ireland, Belfast and Derry. The death rate legend is split into 5 levels for each of the categories mapped. The first level is the number of wards with Nil deaths; the second level is the lowest 50 per cent of death rates; the third level is the next highest 22.5 per cent of death rates; the fourth level is next 22.5 per cent of death rates; and the fifth level are the wards within the top 5 per cent of death rates.
The above set of maps were produced to complement the information on the status of deaths contained in Map Set 4. The above maps indicate the organisations responsible for the killings during the conflict. Each death can be viewed from the point of view of the status of the person killed or viewed from the point of view of the organisation responsible. Obviously the location of a single death/killing remains the same. Republican paramilitaries were responsible for the largest number of killings (2060). This is also reflected in the spread of killings recorded across Belfast, Derry and the rest of Northern Ireland. Loyalist paramilitaries were responsible for 1016 killings during the period of the conflict. The maps show that the geographical spead is less than for Republicans. British security forces were responsible for 363 killings and this lower number is reflected in the maps which show concentrations of killings in particular wards of Belfast, Derry and in specific areas in the rest of the region. These wards correspond strongly to Nationalist areas.
The electoral ward shapefile was downloaded from EDINA borders Web site: The number of deaths is based on the Malcolm Sutton Index of Deaths (1969-2001): The 2001 census population counts for each ward were downloaded from Northern Ireland Statistics and Research Agency (NISRA) Web site:
The GIS maps listed above have been produced as part of the AHRC 'Visualising the Conflict' Project. The maps have been reproduced and made available with the permission of Land & Property Services under Delegated Authority from the Controller of HMSO, © Crown Copyright and database right 2010; Permit Number: 40209. All maps were prepared by Luke Kelleher, then a Research Associate (GIS) working with CAIN. All maps were sized A4 (approximately). GIS software was used to produce TIFF versions (A4 approx; 300dpi) which are available on request. Three versions of each map have been made available above:
Users of the above maps should note that the choice of the number of levels at which to draw the map information, together with the cut-off points used for these levels, depends on decisions made by the researchers involved. While it is true that it would be possible to produce a different set of maps using different cut-off points, the researchers feel that the ones chosen provide the greatest level of clarity, with the greatest level of detail, and reflect the underlying patterns in the data. It is also worth stating that using the population in 2001 as the basis for calculating the death rates is a compromise solution. To be entirely accurate it would be necessary to work out how many people lived in a particular area during the time being considered (1969-2001). The additional time taken to work out these figures would not be rewarded by any significant increase in accuracy. Hence the researchers, as is the case with other researchers, have chosen the population in a particular year to represent the relative population level over the time period. Return to List of Map Sets
|
|||||||||||||||||||||||||||||||||||||||||||||||||||||||||||||
|
Last modified:
January 19, 2012 9:33
|
||
|
|
||
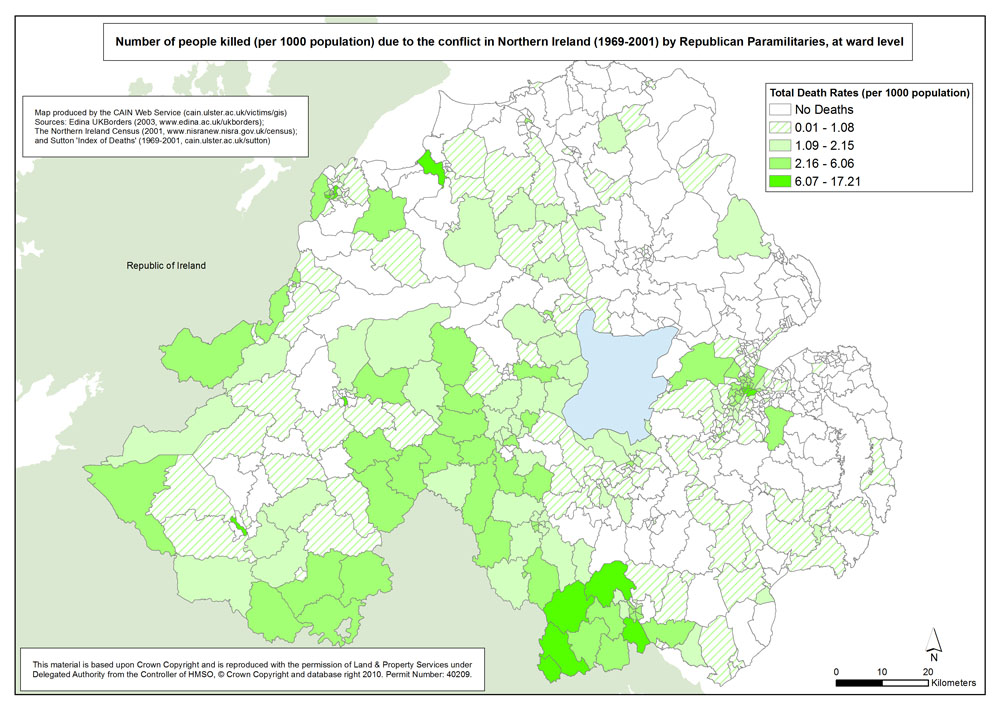 This set of 9 maps illustrates the death rates per 1000 population, for 3 categories of killings, as a result of the conflict in Northern Ireland between 1969 and 2001. The data is mapped at electoral ward level. There are 582 electoral wards in Northern Ireland as defined by the Boundary Commission for Northern Ireland in 1995.
 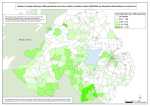 Killings - NI - Republican Killings - Ward
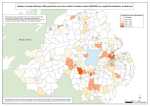 Killings - NI - Loyalist Killings - Ward
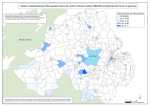 Killings - NI - British Security Forces - Ward
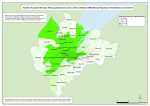 Killings - Belfast - Republican Killings - Ward
 Killings - Belfast - Loyalist Killings - Ward
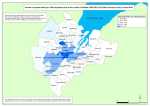 Killings - Belfast - British Security Forces - Ward
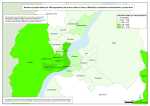 Killings - Derry - Republican Killings - Ward
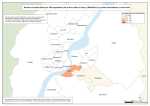 Killings - Derry - Loyalist Killings - Ward
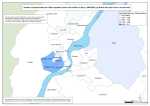 Killings - Derry - British Security Forces - Ward
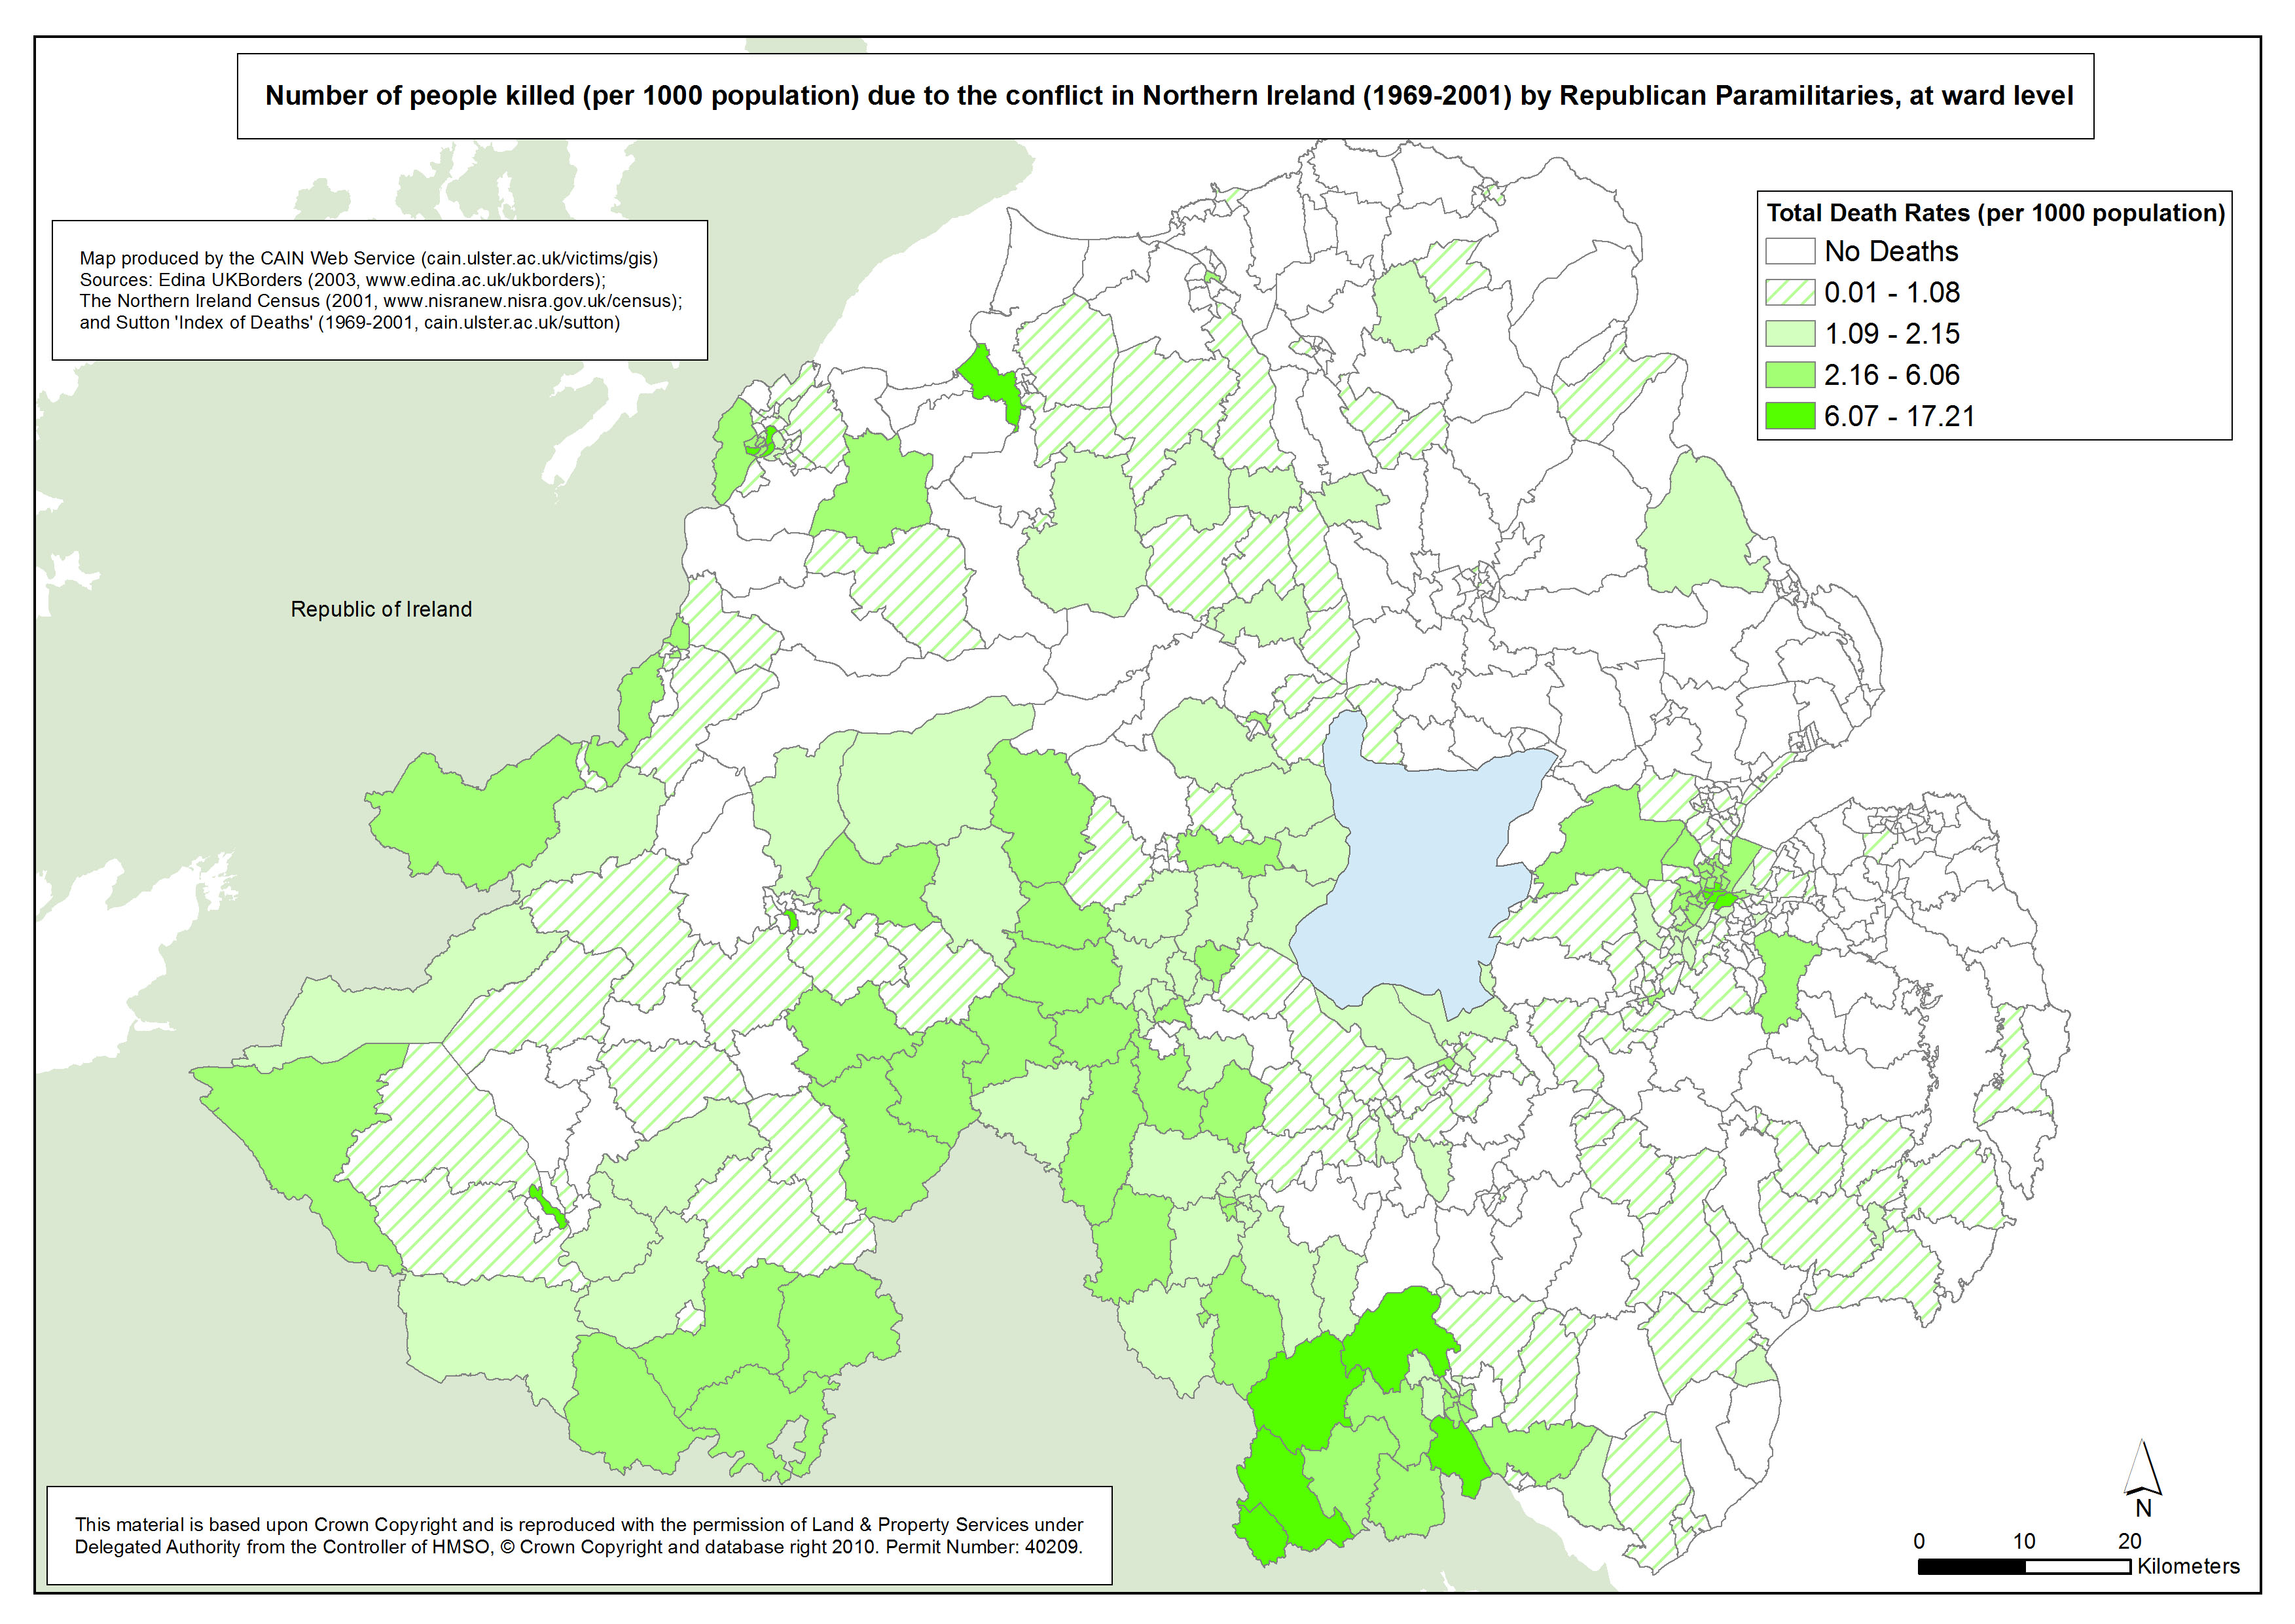