
|
|
|
|
|
|
If you have not used the DRAFT Google Map of deaths due to the conflict in Northern Ireland, please read the following note before proceeding to the map page.
In 1994 Malcolm Sutton published his book 'Bear in mind these dead ... An Index of Deaths from the Conflict in Ireland 1969-1993'. In addition to being a record of the deaths, Sutton intended the book to be a memorial to all those killed. In 1999 Sutton worked with researchers at CAIN to update his Index of Deaths and produce the on-line database. This database was later extended to include deaths from 1969 to 2001. Initially the only location information provided for each death was text-based: the name of the street, road, or building, and broad categories such as counties. In 2008 additional location information in the form of X/Y map co-ordinates were added to Sutton database. Currently this data is not made public in the section containing Sutton's data. The X/Y co-ordinates were added to the original database by Niall Cunningham and Ian Gregory who were then both based at Lancaster University. This work was done in return for access to the Sutton database and CAIN is grateful to the two researchers for their assistance. The work by Cunningham and Gregory formed part of a project funded by the Arts and Humanities Research Council (AHRC) entitled Troubled Geographies: Two Centuries of Religious Division in Ireland. One of the aims of this project was to use Geographical Information Systems (GIS) technology to analyse patterns of fatality across Northern Ireland in relation to aggregate census statistics on religion and other socio-economic indicators. Consequently, in some instances, particularly in rural areas, or where the information was then insufficient to provide a more specific location, individual deaths were allocated to the nearest identifiable place. This was often a townland or village, for which the X/Y co-ordinates were sourced from the former Ordnance Survey of Northern Ireland's gazetteer of placenames across Northern Ireland. As such, the level of accuracy was sufficient for this type of analysis, but not always specific enough to act as the spatial representational to the act of memorial intended by Sutton. It should be noted that the information about many of the locations of individual deaths was vague when first recorded and reported by the media, and some information has been lost in the meantime. Taken together this means that the location information for many deaths is imprecise at the detailed scale that is now available using digital on-line maps. This is not a problem when looking at ward level data or small scale maps but could cause problems when viewed at a very detailed level (large scale).
Nevertheless, while the Project had access to the skills of the Research Associates it was decided to use the existing Sutton database and prepare a DRAFT Google Map of deaths. This has been made available with a warning about the accuracy of the existing X/Y co-ordinates. The zoom level of the map has been set to prevent users zooming to the large scale view. See the URL below for the existing version of the map. Julio Lopez Losada, then a project Research Associate, undertook the programming and scripting work to prepare the draft Google Map of deaths (with the various overlays of information). Luke Kelleher, also a project Research Associate, added additional X/Y co-ordinates for those deaths that occurred in the Republic of Ireland.
Researchers at CAIN will be seeking to improve the information held about the locations of killings in the database. CAIN would welcome feedback which can provide further detail about the location of deaths during the conflict.
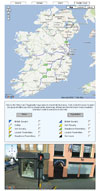
Composition of Web Page There are three main elements on the page displaying the Google Map:
Initial View When a user first views the map there will be no location points displayed. This is because of the large number of deaths (3,528) and the delay that would be caused for the page to open with all the points displayed. Selecting Information for Display So users have to select which deaths they wish to see displayed on the map. The choice and the control is set out as part of the legend (see image below) in the middle of the page directly below the Google Map. There are two columns: Status and Organisation. Status refers to the status of the person killed, and Organisation refers to the group responsible for the killing. Before any pointers will appear on the Google Map at least one box in each column must be ticked. For example if a user wished to see the locations of deaths of all Civilians killed by Loyalist Paramilitaries then the user would have to click on the 'Cilvilian' box in the Status column and also click on the Loyalist Paramilitary box in the Organisation column. To see all Civilian deaths, click on Civilian and then click on all five Organisations. The Map Legend 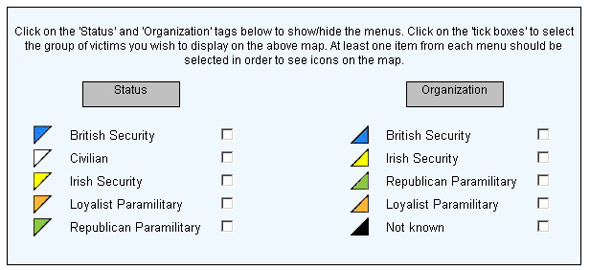
The Pointers / Icons The pointers that appear on the map are small square icons made up of two the two coloured triangles (from the above legend) that represent the colour of the status of the person killed (in the upper-left half of the square) and the colour of the organisation responsible. So in the case of British Security killed by Republican paramilitary the pointer displayed would be: Table of Pointers / Icons Used The full range of pointers (icons) used in the Google Map are displayed in the following table. The table also has the number of deaths in each category based on Sutton's Index of Deaths (1969-2001).
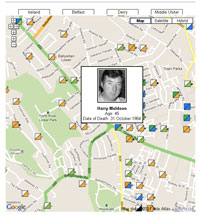
Changing the Map View Once a user has selected the deaths that are to be displayed on the Google Map it is possible to use the tabs at the top of the map as a quick way of zooming to one of the areas listed. However the user can also use the standard Google buttons at the upper left-hand side of the map to either zoom in (+) or zoom out (-), or to move around the map (←, ↑, →, and ↓). It is also possible to 'grab' the map (click and hold with the mouse) and move it around. Users also have the option of viewing the Google Map as a map, or a Satellite image, or a Hybrid of the two. Information Displayed on Rollover When a user rolls over a pointer (icon) additional information is displayed. This information is taken (with permission) from Sutton's Index of Deaths. It gives the name of the person killed, their age, and the date they died. Where a photograph is available in the database then it is displayed alongside this information. Users can then click on the pointer to see the full entry from Sutton's Index which will open in a separate window. If two or more people were killed at the same location then a list of names appears which form links and users can click on a name to see the full entry from Sutton's Index which will open in a separate window. Google Street View Whenever a user has clicked on a pointer then Google Street View opens at the corresponding location. The direction and angle of the opening view have not been manually set to show the precise location where the killing happened. Users should also note that obviously the Street View is based on recent photography and the killings happened many years, sometimes many decades, before so the scene may have changed considerably. The Street View is included to give users a general impression of the location as it currently appears.
The DRAFT Google Map of deaths related to the conflict (based on Sutton's database) is available at the following page:
|
||||||||||||||||||||||||||||||||||||||||||||||||||||||||||||
|
Last modified:
September 23, 2015 16:49
|
||
|
|
||
 As part of the Visualising the Conflict Project it was decided to test the location of deaths by mapping the information in a number of formats. Initially the information was incorporated into a Google Earth map. It was clear that the grid reference information could be improved by using digital mapping but to do this for 3,528 deaths would require a separate work schedule. Based on this assessment it was decided not to release the grid reference information as part of the Sutton data until such time as the X/Y co-ordinates could be checked and improved.