 CAIN Web Service
Background Information on Northern Ireland Society - Education
[CAIN_Home]
[Key_Events]
[KEY_ISSUES]
[Conflict_Background]
NI SOCIETY:
[Agriculture]
[Art_&_Literature]
[Culture]
[Economy]
[EDUCATION]
[Employment]
[Geography]
[Health_&_Social_Security]
[History]
[Housing]
[Income]
[Law_&_Order]
[Media]
[Politics]
[Population]
[Religion]
[Security]
[Tourism] [Transportation]
EDUCATION:
[Menu]
[Reading]
[Summary]
[Chronology]
[Background]
[Main Pages]
[CALM]
[Statistics]
[Sources]
Page Compiled: Fionnuala McKenna, Martin Melaugh
Material is added to this site on a regular basis - information on this page may change
Education in Northern Ireland
Summary
The standard of education is Northern Ireland is considered
to be relatively high. In 1993/94, Northern Ireland had the
lowest proportion of students in their final year of compulsory
schooling who failed to achieve a graded examination result, and
the highest proportion of students in post-compulsory schooling
who achieved 2 or more passes at GCE A Level.[1]
Education attainments in Northern Ireland are rising rapidly. Second level school leavers in Northern Ireland have substantially higher educational attainments than the United Kingdom average. Between 1986 and 1998, the proportion of school leavers who attained three or more 'A' Level qualifications doubled.
The proportion of school leavers entering full-time higher education in Northern Ireland has also increased dramatically between 1986 and 1998. The number of full-time postgraduate students studying in Northern Ireland doubled, while the number of part-time undergraduate students tripled. The proportion of youths in Northern Ireland who proceed to university is higher than any other country in the European Union.
Basically, all schools in Northern Ireland can be divided into 5 categories
(i) Controlled Schools: These are essentially Protestant schools
- they are owned by the Education and Library boards, although
they are mostly controlled by their Boards of Governors. The Protestant
churches are represented on the Board of Governors.
(ii) Catholic Maintained Schools: These are essentially Catholic
schools - they are owned by the Catholic Church but are managed
by a Board of Governors. The Education and Library Boards provide
some financial assistance, by financing recurrent costs and the
employment of non-teaching staff.
(iii) Other Maintained: These are essentially Protestant schools,
in that they are owned by the Protestant church and managed by
a Board of Governors. Like the Catholic maintained schools, they
received funding from the Education and Library Boards for the
recurrent costs.
(iv) Voluntary Grammar: These schools are owned by school trustees
and managed by a Board of Governors.
(v) Grant Maintained Integrated Schools: These are essentially
mixed schools, for Catholic and Protestant children. They are
partially owned by trustees and managed by a Board of Governors,
with their recurrent costs being met by the Department of Education.
The majority of Protestant children in Northern Ireland attend state controlled schools,
whilst the majority of Catholic children attend Catholic maintained
schools. These are essentially Protestant and Catholic schools.
The first integrated school, Lagan College, opened in 1981 with 28 pupils. According to the Northern Ireland Council for Integrated Education (NICIE) there are currently 50 integrated schools in Northern Ireland (during 2003), 18 of which are second level colleges and 32 integrated primaries, educating over 16,000 pupils. This represents almost 5% of the total school going population. The majority (95%) of children are still attending non-integrated schools. For additional information on integrated education see the NICIE web site {external_link}. See also: Table NI-EDC-13: Details of Integrated Schools in Northern Ireland (on separate page).
Girls in Northern Ireland at GCSE[2] and A Level standard achieve
a higher standard of results than boys at the same level.
Compared with the rest of the UK, Northern Ireland has proportionately
more schools with a small number of pupils. In 1995/96, 37 percent of
primary schools in Northern Ireland had less than 100 pupils,
compared with only 15 percent in England.
The number of pupils in Northern Ireland attending Irish Medium Schools is on the increase. In 1994/95, the number of pupils attending these schools was 713, while in 1998/99 the figure had risen to 1,342 pupils.
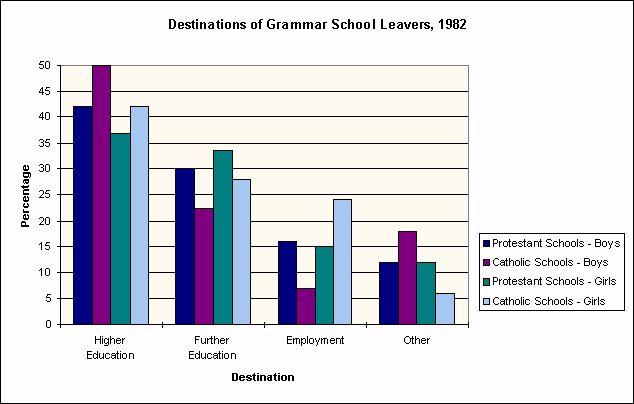
A comparison of School leaver figures from early 1980's and
1990's reveal that fewer school leavers today go directly into
employment, while a greater percentage are now going on to further
and higher education.
Pupils in Catholic schools tend to perform much better in arts
subjects and languages than pupils in Protestant schools, whilst pupils in
Protestant schools tend to perform better in science subjects.
A survey carried out in 1985 showed that a higher proportion of Catholic
school pupils progressed to further and higher education on leaving school than
their counterparts in Protestant schools. A higher proportion of pupils from
Protestant schools went directly into employment.
According to a press release issued by the Department of Education for Northern Ireland (DENI) in March 1999 the reported religion of pupils in schools in Northern Ireland is as follows; 51% Catholic; 42% Protestant; 1% Other Christian; 0.3% Non Christian and 6% No Religion/Not Recorded.
Sources:
The following tables provide further details regarding education in
Northern Ireland. Much of this material has been taken from the Northern
Ireland Annual Abstract of Statistics (1996), Regional Trends (1996), The
Majority Minority Review 1: Education in a Divided Society, by A M Gallagher.
and the Irish Almanac and Yearbook of Facts (1997).
Additional information can be obtained from the section on Key Issues - Education in Northern Ireland and Discrimination and Education in Northern Ireland.
Additional up to date statistical information can be found at the following websites:
(i) Department of Education for Northern Ireland - Key Information & Statistics {external_link}
(ii) Statbase - UK National Statistics Online {external_link}
List of Tables
Primary Education in Northern Ireland: Pupils, Teachers and
Schools
Number of schools by School Type, Religion and Area Board
Qualifications of Northern Ireland School Leavers
Examination Achievements of Pupils in Schools, 1995/1996: England,
Scotland Wales and Northern Ireland
Destinations of School Leavers in Northern Ireland, 1988-1998
Higher Education in Northern Ireland, 1988-1998
University Graduates in Northern Ireland, 1987-1996
Destinations of Protestant and Catholic Grammar Schoool children, 1982
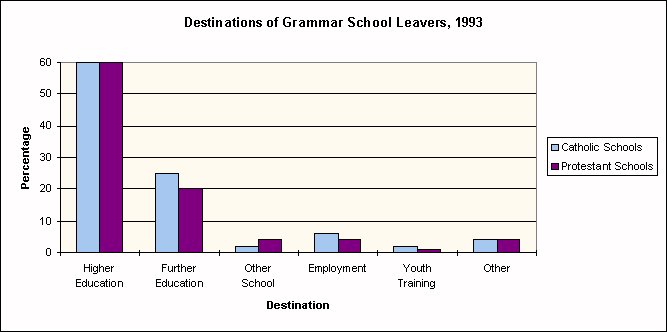
Destinations of Protestant and Catholic Grammar Schoool children, 1993
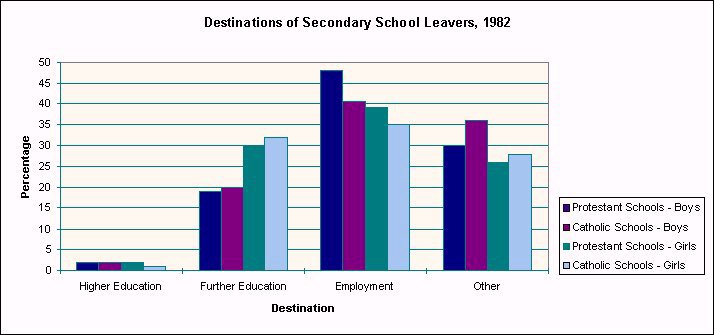
Destinations of Protestant and Catholic Secondary Schoool children, 1982
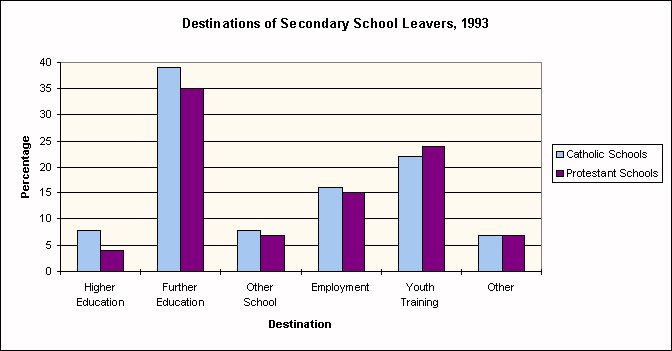
Destinations of Protestant and Catholic Secondary Schoool children, 1993
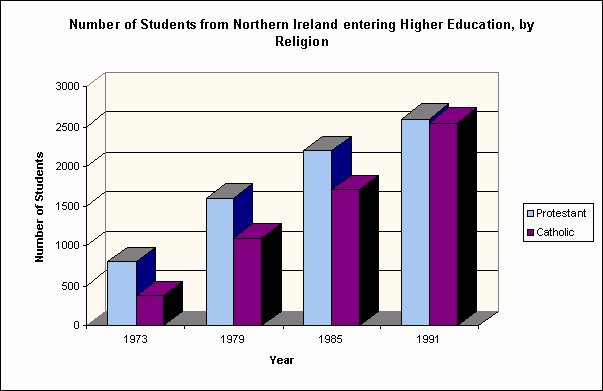
Number of Students from Northern Ireland entering Higher Education: Breakdown
according to religion.
Table NI-EDC-13: Details of Integrated Schools in Northern Ireland (on separate page)
Primary Education in Northern Ireland: Pupils, Teachers and Schools
| |
Schools |
Teachers |
Pupils |
|
1980/81 |
|
Controlled |
562 |
4,206 |
99,943 |
|
Maintained |
481 |
3,827 |
91,323 |
|
Other Voluntary |
5 |
20 |
423 |
|
Preparatory |
24 |
164 |
3,940 |
|
1985/86 |
|
Controlled |
516 |
3,907 |
90,014 |
|
Maintained* |
481 |
3,752 |
90,762 |
|
Other Voluntary |
4 |
15 |
311 |
|
Preparatory |
21 |
135 |
3,274 |
|
1990/91 |
|
Controlled |
495 |
3,913 |
90,181 |
|
Maintained* |
477 |
3,142 |
95,610 |
|
Other Voluntary |
2 |
4 |
93 |
|
Preparatory |
19 |
123 |
3,104 |
Note: * Includes pupils in planned integrated schools: in 1992 this accounted for approximately 1,800 pupils
(Source: A. M. Gallagher, Majority Minority Review1, Education in a Divided Society: A Review of Research and Policy, 2nd edition, 1995)
Number of schools in Northern Ireland, by School Type, Religion and Area Board [3]
| |
BELB |
WELB |
NEELB |
SEELB |
SELB |
TOTAL |
|
Catholic Grammar |
5 |
7 |
5 |
3 |
10 |
30 |
|
Catholic Secondary |
12 |
24 |
14 |
9 |
20 |
79 |
| |
|
|
Protestant Grammar |
10 |
6 |
12 |
7 |
5 |
40 |
|
Protestant Secondary |
10 |
11 |
24 |
19 |
16 |
80 |
| |
|
|
Integrated Secondary |
1 |
1 |
0 |
1 |
1 |
4 |
| |
|
|
|
|
|
|
|
Total No. Schools per Board |
38 |
49 |
55 |
39 |
52 |
233 |
(Source: A. M. Gallagher, Majority Minority Review 1, Education in a Divided Society: A Review of Research and Policy, 2nd edition, 1995)
Qualifications of School Leavers in Northern Ireland
|
|
1988/
89 |
1989/
90 |
1990/
91 |
1991/
92 |
1992/
93 |
1993/
94 |
1994/
95 |
1995/
96 |
1996/
97 |
1997/
98 |
|
All School Leavers |
25,088 |
24,522 |
23,693 |
23,481 |
22,316 |
23,355 |
24,533 |
25,674 |
25,717 |
- |
|
% of leavers whose highest qualification was: |
|
3 or more 'A' Levels |
17.6 |
19.3 |
20.7 |
22.8 |
23.8 |
24.1 |
24.1 |
23.5 |
25.9 |
- |
|
2 'A' Levels |
6.7 |
6.9 |
7.3 |
6.3 |
6.8 |
6.6 |
6.6 |
6.7 |
6.6 |
- |
|
1 'A' Level |
3.5 |
3.8 |
3.7 |
3.1 |
3.2 |
3.0 |
3.0 |
2.3 |
2.1 |
- |
|
No 'A' Levels but 5 or more GCSEs (A*-C grades) |
10.8 |
11.3 |
13.0 |
13.3 |
15.7 |
17.0 |
17.0 |
18.9 |
19.8 |
- |
|
1-4 GCSE (A*-C grades) |
24.8 |
24.8 |
24.9 |
25.9 |
26.9 |
26.4 |
26.4 |
24.8 |
23.3 |
- |
|
1+ GCSEs (D-G grades) |
17.6 |
18.6 |
17.4 |
16.8 |
16.4 |
16.8 |
16.8 |
17.2 |
16.2 |
- |
|
Qualifications other than GCSE/
GCE/ GNVQ |
6.3 |
5.3 |
4.4 |
4.3 |
2.2 |
2.3 |
2.3 |
2.1 |
2.6 |
- |
|
No formal qualifications of any kind |
12.7 |
10.0 |
8.6 |
7.4 |
4.9 |
3.8 |
3.8 |
1.5 |
3.6 |
- |
Source: Department of Education Northern Ireland: Compendium of Northern Ireland Statistics, 1985/86 to 1997/98
Examination Achievements of Pupils in Schools, 1995/1996: A comparison of results for England, Scotland Wales and Northern Ireland
|
|
Pupils in their last year of compulsory schooling |
Pupils /students in education achieving 2 or more A levels/
3 or more SCE Highers
(percentages) |
|
|
Percentage achieving GCSE's or SCE Standard Grade |
|
|
|
5 or more grades A*-C |
1-4 grades A* -C |
Grades D-G only |
No graded results |
Total (=100%) (thousands) |
|
England |
44.5 |
25.7 |
22.0 |
7.8 |
594.0 |
29.6 |
|
Wales |
41.6 |
24.3 |
23.3 |
10. 8 |
37.2 |
27.0 |
|
Scotland |
53.6 |
28.9 |
13.9 |
3.6 |
65.2 |
29.3 |
|
Northern Ireland |
51.6 |
26.1 |
17.7 |
4.6 |
26.4 |
35.9 |
Source: Regional Trends, 1998, p.56
Destinations of School Leavers in Northern Ireland
|
Destination of school leavers: |
1988/
89 |
1989/
90 |
1990/
91 |
1991/
92 |
1992/
93 |
1993/
94 |
1994/
95 |
1995/
96 |
1996/
97 |
1997/
98 |
|
Institutions of Higher Education |
19.6 |
21.1 |
22.0 |
23.9 |
25.9 |
26.0 |
26.0 |
25.0 |
28.2 |
- |
|
Institutions of Further Education |
28.5 |
30.9 |
33.4 |
34.2 |
36.4 |
35.0 |
35.0 |
35.6 |
32.6 |
- |
|
Other Destinations |
41.7 |
39.3 |
36.3 |
36.2 |
33.3 |
34.3 |
34.3 |
37.2 |
37.6 |
- |
|
Destination Unknown |
10.2 |
8.7 |
8.3 |
5.6 |
4.4 |
4.7 |
4.7 |
2.1 |
1.6 |
- |
Source: Department of Education Northern Ireland: Compendium of Northern Ireland Statistics, 1985/86 to 1997/98
Higher Education in Northern Ireland, 1988-1998
|
|
1988/
89 |
1989/
90 |
1990/
91 |
1991/
92 |
1992/
93 |
1993/
94 |
1994/
95 |
1995/
96 |
1996/
97 |
1997/
98 |
|
Students studying in Northern Ireland [1] |
|
Full-time Undergraduate |
16,311 |
17,095 |
18,072 |
19,368 |
21,065 |
22,990 |
24,551 |
25,943 |
26,164 |
28,090 |
|
Part-Time Undergraduate |
5,411 |
5,382 |
5,950 |
6,494 |
7,000 |
7,174 |
7,667 |
10,495 |
12.626 |
14,399 |
|
Full-Time Postgraduate |
1,601 |
1,671 |
1,896 |
2,216 |
2,360 |
2,666 |
2,693 |
3,029 |
3,258 |
3,359 |
|
Part-Time Postgraduate |
2,735 |
3,109 |
3,578 |
4,054 |
4,413 |
4,833 |
4,802 |
4,704 |
5,330 |
4,489 |
|
Northern Ireland Domiciled Students [2] |
|
Full-Time Undergraduate |
21,869 |
23,379 |
24,617 |
26,324 |
28,81-0 |
31,331 |
33,248 |
34,546 |
34,940 |
37,028 |
|
Part-Time Undergraduate |
Open University |
- |
- |
- |
- |
- |
- |
1,979 |
2,583 |
2,639 |
2,723 |
|
Other Institutions |
5,353 |
5,258 |
5,949 |
6,453- |
7,024 |
7,276 |
7,958 |
10,697 |
12,440 |
14,301 |
|
Total |
- |
- |
- |
- |
- |
- |
9,937 |
13,280 |
15,079 |
17,024 |
|
Full-Time Postgraduate |
1,800 |
1,987 |
2,186 |
2,525 |
2,675 |
2,871 |
3,028 |
3,297 |
3,382 |
3,631 |
|
Part-Time Postgraduate |
Open University |
- |
- |
- |
- |
- |
- |
487 |
605 |
377 |
103 |
|
Other Institutions |
2,675 |
3,030 |
3,485 |
3,901 |
4,172 |
4,620 |
4,582 |
4,564 |
5,273 |
4,452 |
|
Total |
- |
|
- |
- |
- |
- |
5,069 |
5,169 |
5,650 |
4,555 |
Notes:
[1] Students studying in Northern Ireland irrespective of domicile
[2] Includes students studying anywhere in the UK or Republic of Ireland
Source: Department of Education Northern Ireland: Compendium of Northern Ireland Education Statistics, 2000
University Graduates in Northern Ireland, 1987-1996
|
|
1987 |
1988 |
1989 |
1990 |
1991 |
1992 |
1993 |
1994/95* |
1995/96 |
|
First Degrees - Honours |
2,588 |
2,796 |
3,262 |
3,179 |
3,448 |
3,621 |
4,013 |
4,809 |
5,105 |
|
First Degrees - Ordinary |
646 |
654 |
651 |
465 |
499 |
593 |
406 |
546 |
641 |
|
Higher Degrees |
796 |
849 |
877 |
948 |
1,070 |
1,290 |
1,548 |
1,376 |
1,604 |
|
All Degrees |
4,030 |
4,299 |
4,790 |
4,592 |
5,017 |
5,504 |
5,967 |
6,731 |
7,350 |
|
Diplomas, Certificates and other qualifications |
1,969 |
2,166 |
2,094 |
2,330 |
2,551 |
2,766 |
2,929 |
3,309 |
2,424 |
(Source: Northern Ireland Annual Abstract of Statistics, 1998, p.64)
* From 1994/95 onwards, the basis on which the count of degrees and diplomas is taken changed from calendar years to academic years.
 (Source: A. M. Gallagher, Majority Minority Review1, Education
in a Divided Society: A Review of Research and Policy, 2nd
edition, 1995)
(Source: A. M. Gallagher, Majority Minority Review1, Education
in a Divided Society: A Review of Research and Policy, 2nd
edition, 1995)
 (Source: A. M. Gallagher, Majority Minority Review1, Education
in a Divided Society: A Review of Research and Policy, 2nd
edition, 1995)
(Source: A. M. Gallagher, Majority Minority Review1, Education
in a Divided Society: A Review of Research and Policy, 2nd
edition, 1995)
 (Source: A. M. Gallagher, Majority Minority Review1, Education
in a Divided Society: A Review of Research and Policy, 2nd
edition, 1995)
(Source: A. M. Gallagher, Majority Minority Review1, Education
in a Divided Society: A Review of Research and Policy, 2nd
edition, 1995)
 (Source: A. M. Gallagher, Majority Minority Review1, Education
in a Divided Society: A Review of Research and Policy, 2nd
edition, 1995)
(Source: A. M. Gallagher, Majority Minority Review1, Education
in a Divided Society: A Review of Research and Policy, 2nd
edition, 1995)
 (Source: A. M. Gallagher, Majority Minority Review1, Education
in a Divided Society: A Review of Research and Policy, 2nd
edition, 1995)
(Source: A. M. Gallagher, Majority Minority Review1, Education
in a Divided Society: A Review of Research and Policy, 2nd
edition, 1995)
Footnotes:
| [1] | General Certificate of Education(GCE) A Level is the standard examination
taken by pupils in their final year at school, generally at the age of 18. Passes
at A Level standard are a requirement for university entry. |
| [2] | General Certificate of Secondary Education (GCSE) are the standard
examinations taken by all schoolchildren in Northern Ireland at the age of 16. |
| [3] |
BELB: Belfast Education and Library Board
WELB: Wester Education and Library Board
NEELB: North Eastern Education and Library Board
SEELB: South Eastern Education and Library Board
SELB: Southern Education and Library Board | |
|